Albertsons 2011 Annual Report Download - page 57
Download and view the complete annual report
Please find page 57 of the 2011 Albertsons annual report below. You can navigate through the pages in the report by either clicking on the pages listed below, or by using the keyword search tool below to find specific information within the annual report.-
 1
1 -
2
-
3
-
4
-
5
-
6
-
7
-
8
-
9
-
10
-
11
-
12
-
13
-
14
-
15
-
16
-
17
-
18
-
19
-
20
-
21
-
22
-
23
-
24
-
25
-
26
-
27
-
28
-
29
-
30
-
31
-
32
-
33
-
34
-
35
-
36
-
37
-
38
-
39
-
40
-
41
-
42
-
43
-
44
-
45
-
46
-
 47
47 -
 48
48 -
 49
49 -
 50
50 -
 51
51 -
 52
52 -
 53
53 -
 54
54 -
 55
55 -
 56
56 -
 57
57 -
 58
58 -
 59
59 -
 60
60 -
 61
61 -
 62
62 -
 63
63 -
 64
64 -
 65
65 -
 66
66 -
 67
67 -
68
-
69
-
70
-
71
-
72
-
73
-
74
-
75
-
76
-
77
-
78
-
79
-
80
-
81
-
82
-
83
-
84
-
85
-
86
-
87
-
88
-
89
-
90
-
91
-
92
 |
 |

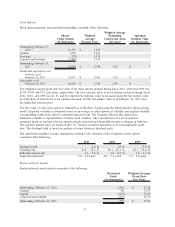
Stock Options
Stock options granted, exercised and outstanding consisted of the following:
Shares
Under Option
(In thousands)
Weighted
Average
Exercise Price
Weighted Average
Remaining
Contractual Term
(In years)
Aggregate
Intrinsic Value
(In thousands)
Outstanding, February 27,
2010 21,374 $ 31.67
Granted 3,228 12.66
Exercised (129) 14.74
Canceled and forfeited (2,469) 27.94
Outstanding, February 26,
2011 22,004 $ 29.40 3.24 $ 7
Vested and expected to vest
in future as of
February 26, 2011 21,657 $ 29.64 3.20 $ 6
Exercisable as of
February 26, 2011 16,645 $ 32.54 2.54 $ —
The weighted average grant date fair value of all stock options granted during fiscal 2011, 2010 and 2009 was
$3.99, $4.92 and $7.91 per share, respectively. The total intrinsic value of stock options exercised during fiscal
2011, 2010, and 2009 was $1, $1 and $4, respectively. Intrinsic value is measured using the fair market value
as of the date of exercise for stock options exercised and the fair market value as of February 26, 2011, less
the applicable exercise price.
The fair value of each stock option is estimated as of the date of grant using the Black-Scholes option pricing
model. Expected volatility is estimated based on an average of actual historical volatility and implied volatility
corresponding to the stock option’s estimated expected term. The Company believes this approach to
determine volatility is representative of future stock volatility. The expected term of a stock option is
estimated based on analysis of stock options already exercised and foreseeable trends or changes in behavior.
The risk-free interest rates are based on the U.S. Treasury securities maturities as of each applicable grant
date. The dividend yield is based on analysis of actual historical dividend yield.
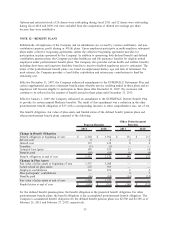
The significant weighted average assumptions relating to the valuation of the Company’s stock options
consisted of the following:
2011 2010 2009
Dividend yield 2.0 % 2.0 % 2.0 %
Volatility rate 42.8 – 50.2 % 38.4 – 42.2 % 28.1 – 59.4 %
Risk-free interest rate 1.1 – 1.8 % 1.8 – 2.8 % 1.0 – 3.6 %
Expected option life 4.0 – 5.4 years 4.0 – 5.4 years 1.0 – 5.4 years
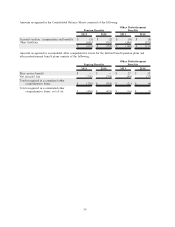
Restricted Stock Awards
Restricted stock award activity consisted of the following:
Restricted
Stock
(In thousands)
Weighted Average
Grant-Date
Fair Value
Outstanding, February 27, 2010 1,303 $ 22.28
Granted 80 13.47
Lapsed (295) 13.45
Canceled and forfeited (233) 28.94
Outstanding, February 26, 2011 855 $ 17.86
53