Albertsons 2011 Annual Report Download - page 23
Download and view the complete annual report
Please find page 23 of the 2011 Albertsons annual report below. You can navigate through the pages in the report by either clicking on the pages listed below, or by using the keyword search tool below to find specific information within the annual report.-
 1
1 -
2
-
3
-
4
-
5
-
6
-
7
-
8
-
9
-
10
-
11
-
12
-
 13
13 -
 14
14 -
 15
15 -
 16
16 -
 17
17 -
 18
18 -
 19
19 -
 20
20 -
 21
21 -
 22
22 -
 23
23 -
 24
24 -
 25
25 -
 26
26 -
 27
27 -
 28
28 -
 29
29 -
 30
30 -
 31
31 -
 32
32 -
 33
33 -
34
-
35
-
36
-
37
-
38
-
39
-
40
-
41
-
42
-
43
-
44
-
45
-
46
-
47
-
48
-
49
-
50
-
51
-
52
-
53
-
54
-
55
-
56
-
57
-
58
-
59
-
60
-
61
-
62
-
63
-
64
-
65
-
66
-
67
-
68
-
69
-
70
-
71
-
72
-
73
-
74
-
75
-
76
-
77
-
78
-
79
-
80
-
81
-
82
-
83
-
84
-
85
-
86
-
87
-
88
-
89
-
90
-
91
-
92
 |
 |

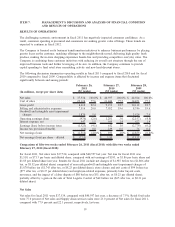
ITEM 7. MANAGEMENT’S DISCUSSION AND ANALYSIS OF FINANCIAL CONDITION
AND RESULTS OF OPERATIONS
RESULTS OF OPERATIONS
The challenging economic environment in fiscal 2011 has negatively impacted consumer confidence. As a
result, consumer spending is pressured and consumers are seeking greater value offerings. These trends are
expected to continue in fiscal 2012.
The Company is focused on its business transformation initiatives to enhance business performance by placing
greater focus on the customer, matching offerings to the neighborhoods served, delivering high quality fresh
produce, making the in-store shopping experience hassle-free and providing competitive everyday value. The
Company is combining these customer initiatives with reducing its overall cost structure through the use of
improved business tools and further leveraging of its size. In addition, the Company continues to provide
capital spending to fund retail store remodeling activity and new hard-discount stores.
The following discussion summarizes operating results in fiscal 2011 compared to fiscal 2010 and for fiscal
2010 compared to fiscal 2009. Comparability is affected by income and expense items that fluctuated
significantly between and among periods:
(In millions, except per share data)
February 26,
2011
(52 weeks)
February 27,
2010
(52 weeks)
February 28,
2009
(53 weeks)
Net sales $ 37,534 100.0% $ 40,597 100.0% $ 44,564 100.0%
Cost of sales 29,124 77.6 31,444 77.5 34,451 77.3
Gross profit 8,410 22.4 9,153 22.5 10,113 22.7
Selling and administrative expenses 7,516 20.0 7,952 19.6 8,746 19.6
Goodwill and intangible asset impairment
charges 1,870 5.0 — — 3,524 7.9
Operating earnings (loss) (976) (2.6) 1,201 3.0 (2,157) (4.8)
Interest expense, net 547 1.5 569 1.4 622 1.4
Earnings (loss) before income taxes (1,523) (4.1) 632 1.6 (2,779) (6.2)
Income tax provision (benefit) (13) 0.0 239 0.6 76 0.2
Net earnings (loss) $ (1,510) (4.0)% $ 393 1.0% $ (2,855) (6.4)%
Net earnings (loss) per share – diluted $ (7.13) $ 1.85 $ (13.51)
Comparison of fifty-two weeks ended February 26, 2011 (fiscal 2011) with fifty-two weeks ended
February 27, 2010 (fiscal 2010):
For fiscal 2011, Net sales were $37,534, compared with $40,597 last year. Net loss for fiscal 2011 was
$1,510, or $7.13 per basic and diluted share, compared with net earnings of $393, or $1.86 per basic share and
$1.85 per diluted share last year. Results for fiscal 2011 include net charges of $1,987 before tax ($1,806 after
tax, or $8.52 per diluted share) comprised of non-cash goodwill and intangible asset impairment charges of
$1,870 before tax ($1,743 after tax, or $8.23 per diluted share), store closure and exit costs of $99 before tax
($77 after tax, or $0.37 per diluted share) and employee-related expenses, primarily labor buyout costs,
severance, and the impact of a labor dispute of $80 before tax ($51 after tax, or $0.23 per diluted share),
partially offset by a gain on the sale of Total Logistic Control of $62 before tax ($65 after tax, or $0.31 per
diluted share).
Net Sales
Net sales for fiscal 2011 were $37,534, compared with $40,597 last year, a decrease of 7.5%. Retail food sales
were 77.0 percent of Net sales and Supply chain services sales were 23.0 percent of Net sales for fiscal 2011,
compared with 77.9 percent and 22.1 percent, respectively, last year.
19