Albertsons 2011 Annual Report Download - page 50
Download and view the complete annual report
Please find page 50 of the 2011 Albertsons annual report below. You can navigate through the pages in the report by either clicking on the pages listed below, or by using the keyword search tool below to find specific information within the annual report.-
 1
1 -
2
-
3
-
4
-
5
-
6
-
7
-
8
-
9
-
10
-
11
-
12
-
13
-
14
-
15
-
16
-
17
-
18
-
19
-
20
-
21
-
22
-
23
-
24
-
25
-
26
-
27
-
28
-
29
-
30
-
31
-
32
-
33
-
34
-
35
-
36
-
37
-
38
-
39
-
 40
40 -
 41
41 -
 42
42 -
 43
43 -
 44
44 -
 45
45 -
 46
46 -
 47
47 -
 48
48 -
 49
49 -
 50
50 -
 51
51 -
 52
52 -
 53
53 -
 54
54 -
 55
55 -
 56
56 -
 57
57 -
 58
58 -
 59
59 -
 60
60 -
61
-
62
-
63
-
64
-
65
-
66
-
67
-
68
-
69
-
70
-
71
-
72
-
73
-
74
-
75
-
76
-
77
-
78
-
79
-
80
-
81
-
82
-
83
-
84
-
85
-
86
-
87
-
88
-
89
-
90
-
91
-
92
 |
 |

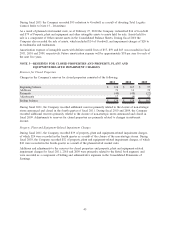
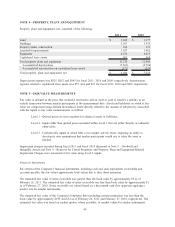
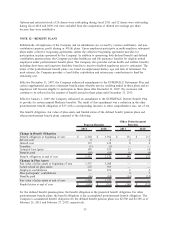
NOTE 4—PROPERTY, PLANT AND EQUIPMENT
Property, plant and equipment, net, consisted of the following:
2011 2010
Land $ 1,260 $ 1,277
Buildings 3,567 3,550
Property under construction 296 232
Leasehold improvements 1,627 1,602
Equipment 4,525 4,455
Capitalized lease assets 963 968
Total property plant and equipment 12,238 12,084
Accumulated depreciation (5,263) (4,724)
Accumulated amortization on capitalized lease assets (371) (334)
Total property, plant and equipment, net $ 6,604 $ 7,026
Depreciation expense was $825, $852 and $945 for fiscal 2011, 2010 and 2009, respectively. Amortization
expense related to capitalized lease assets was $57, $64 and $67 for fiscal 2011, 2010 and 2009, respectively.
NOTE 5—FAIR VALUE MEASUREMENTS
Fair value is defined as the price that would be received to sell an asset or paid to transfer a liability in an
orderly transaction between market participants at the measurement date. Assets and liabilities recorded at fair
value are categorized using defined hierarchical levels directly related to the amount of subjectivity associated
with the inputs to fair value measurements, as follows:
Level 1 - Quoted prices in active markets for identical assets or liabilities;
Level 2 - Inputs other than quoted prices included within Level 1 that are either directly or indirectly
observable;
Level 3 - Unobservable inputs in which little or no market activity exists, requiring an entity to
develop its own assumptions that market participants would use to value the asset or
liability.
Impairment charges recorded during fiscal 2011 and fiscal 2010 discussed in Note 2 – Goodwill and
Intangible Assets and Note 3—Reserves for Closed Properties and Property, Plant and Equipment-Related
Impairment Charges were measured at fair value using Level 3 inputs.
Financial Instruments
For certain of the Company’s financial instruments, including cash and cash equivalents, receivables and
accounts payable, the fair values approximate book values due to their short maturities.
The estimated fair value of notes receivable was greater than the book value by approximately $3 as of
February 26, 2011. The estimated fair value of notes receivable was less than book value by approximately $1
as of February 27, 2010. Notes receivable are valued based on a discounted cash flow approach applying a
market rate for similar instruments.
The estimated fair value of the Company’s long-term debt (including current maturities) was less than the
book value by approximately $189 and $54 as of February 26, 2011 and February 27, 2010, respectively. The
estimated fair value was based on market quotes, where available, or market values for similar instruments.
46