Albertsons 2011 Annual Report Download - page 38
Download and view the complete annual report
Please find page 38 of the 2011 Albertsons annual report below. You can navigate through the pages in the report by either clicking on the pages listed below, or by using the keyword search tool below to find specific information within the annual report.-
 1
1 -
2
-
3
-
4
-
5
-
6
-
7
-
8
-
9
-
10
-
11
-
12
-
13
-
14
-
15
-
16
-
17
-
18
-
19
-
20
-
21
-
22
-
23
-
24
-
25
-
26
-
27
-
 28
28 -
 29
29 -
 30
30 -
 31
31 -
 32
32 -
 33
33 -
 34
34 -
 35
35 -
 36
36 -
 37
37 -
 38
38 -
 39
39 -
 40
40 -
 41
41 -
 42
42 -
 43
43 -
 44
44 -
 45
45 -
 46
46 -
 47
47 -
 48
48 -
49
-
50
-
51
-
52
-
53
-
54
-
55
-
56
-
57
-
58
-
59
-
60
-
61
-
62
-
63
-
64
-
65
-
66
-
67
-
68
-
69
-
70
-
71
-
72
-
73
-
74
-
75
-
76
-
77
-
78
-
79
-
80
-
81
-
82
-
83
-
84
-
85
-
86
-
87
-
88
-
89
-
90
-
91
-
92
 |
 |

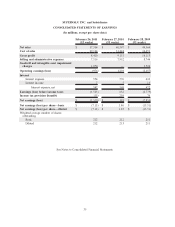
SUPERVALU INC. and Subsidiaries
CONSOLIDATED SEGMENT FINANCIAL INFORMATION
(In millions)
February 26, 2011
(52 weeks)
February 27, 2010
(52 weeks)
February 28, 2009
(53 weeks)
Net sales
Retail food $ 28,911 $ 31,637 $ 34,664
% of total 77.0% 77.9% 77.8%
Supply chain services 8,623 8,960 9,900
% of total 23.0% 22.1% 22.2%
Total net sales $ 37,534 $ 40,597 $ 44,564
100.0% 100.0% 100.0%
Operating earnings (loss)
Retail food $ (1,212) $ 989 $ (2,315)
% of sales (4.2)% 3.1% (6.7)%
Supply chain services 337 299 307
% of sales 3.9% 3.3% 3.1%
Corporate (101) (87) (149)
Total operating earnings (loss) (976) 1,201 (2,157)
% of sales (2.6)% 3.0% (4.8)%
Interest expense, net 547 569 622
Earnings (loss) before income taxes (1,523) 632 (2,779)
Income tax provision (benefit) (13) 239 76
Net earnings (loss) $ (1,510) $ 393 $ (2,855)
Depreciation and amortization
Retail food $ 849 $ 876 $ 968
Supply chain services 76 81 89
Total $ 925 $ 957 $ 1,057
Capital expenditures
Retail food $ 559 $ 642 $ 1,112
Supply chain services 45 49 100
Total $ 604 $ 691 $ 1,212
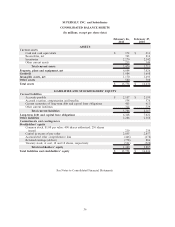
Identifiable assets
Retail food $ 11,589 $ 14,035 $ 14,950
Supply chain services 2,050 2,214 2,444
Corporate 119 187 210
Total $ 13,758 $ 16,436 $ 17,604
Refer to Note 14 – Segment Information in the accompanying Notes to Consolidated Financial Statements for
additional information concerning the Company’s reportable segments.
See Notes to Consolidated Financial Statements.
34