Albertsons 2011 Annual Report Download - page 24
Download and view the complete annual report
Please find page 24 of the 2011 Albertsons annual report below. You can navigate through the pages in the report by either clicking on the pages listed below, or by using the keyword search tool below to find specific information within the annual report.-
 1
1 -
2
-
3
-
4
-
5
-
6
-
7
-
8
-
9
-
10
-
11
-
12
-
13
-
 14
14 -
 15
15 -
 16
16 -
 17
17 -
 18
18 -
 19
19 -
 20
20 -
 21
21 -
 22
22 -
 23
23 -
 24
24 -
 25
25 -
 26
26 -
 27
27 -
 28
28 -
 29
29 -
 30
30 -
 31
31 -
 32
32 -
 33
33 -
 34
34 -
35
-
36
-
37
-
38
-
39
-
40
-
41
-
42
-
43
-
44
-
45
-
46
-
47
-
48
-
49
-
50
-
51
-
52
-
53
-
54
-
55
-
56
-
57
-
58
-
59
-
60
-
61
-
62
-
63
-
64
-
65
-
66
-
67
-
68
-
69
-
70
-
71
-
72
-
73
-
74
-
75
-
76
-
77
-
78
-
79
-
80
-
81
-
82
-
83
-
84
-
85
-
86
-
87
-
88
-
89
-
90
-
91
-
92
 |
 |
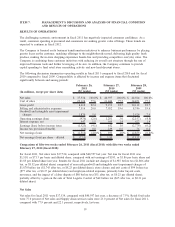
Retail food sales for fiscal 2011 were $28,911, compared with $31,637 last year, a decrease of 8.6%. The
decrease primarily reflects negative identical store retail sales growth (defined as stores operating for four full
quarters, including store expansions and excluding fuel and planned store dispositions) and the impact of store
dispositions. For fiscal 2011, as compared to fiscal 2010, identical store retail sales growth was negative
6.0 percent. Identical store retail sales performance was primarily a result of heightened value-focused
competitive activity and the impact of the challenging economic environment on consumers.
During fiscal 2011 the Company added 132 new stores through new store development, comprised of 3
traditional retail food stores and 129 hard-discount food stores, and sold or closed 87 stores, including planned
dispositions, of which 50 were traditional retail food stores and 37 were hard-discount food stores.
Total retail square footage as of the end of fiscal 2011 was approximately 64 million, a decrease of
1.7 percent from the end of fiscal 2010. Total retail square footage, excluding actual and planned store
dispositions, increased 1.7 percent from the end of fiscal 2010. Supply chain services sales for fiscal 2011
were $8,623, compared with $8,960 last year, a decrease of 3.8%. The decrease primarily reflects the
completion of a national retail customer’s previously announced plans to transition certain volume to self-
distribution and the loss of a customer due to acquisition by a competitor net of new business during fiscal
2011.
Gross Profit
Gross profit, as a percent of Net sales, was 22.4 percent for fiscal 2011 compared with 22.5 percent last year.
The decrease is primarily attributable to the impact of business segment sales mix. Retail food gross profit as
a percent of Net sales was 27.5 percent for fiscal 2011 compared with 27.4 percent last year. The increase is
due to improved promotional effectiveness and a change in product mix. Supply chain gross profit as a percent
of Net sales for fiscal 2011 was consistent with last year at 5.4 percent.
Selling and Administrative Expenses
Selling and administrative expenses, as a percent of Net sales, were 20.0 percent for fiscal 2011, compared
with 19.6 percent last year. The increase primarily reflects reduced sales leverage, increased store closure and
exit costs, and increased employee-related expenses, partially offset by savings achieved from ongoing cost
reduction initiatives and a gain related to the sale of Total Logistic Control.
Goodwill and intangible asset impairment charges
During fiscal 2011 the Company recorded non-cash impairment charges of $1,870 in the Retail food segment
due to the significant decline in its market capitalization and the impact of the challenging economic
environment on the Company’s operations. No goodwill impairment charges were recorded in fiscal 2010.
Operating Earnings (Loss)
Operating loss for fiscal 2011 was $976 compared with operating earnings of $1,201 last year. Retail food
operating loss for fiscal 2011 was $1,212, or negative 4.2 percent of Retail food net sales compared with
operating earnings of $989 or 3.1 percent of Retail food net sales last year. The decrease reflects goodwill and
intangible asset impairment charges of $1,870, or 6.5 percent of Retail food sales, store closure and exit costs
of $99, or 0.3 percent of Retail food sales, and certain other costs primarily related to labor buy-out costs,
severance and the impact of a labor dispute of $80, or 0.3 percent of Retail food sales. The remaining
decrease of $152, or 20 basis points, is primarily attributable to increased promotional spending and reduced
sales leverage.
Supply chain services operating earnings for fiscal 2011 were $337, or 3.9 percent of Supply chain services
net sales, compared with $299, or 3.3 percent of Supply chain services net sales, last year. The increase
primarily reflects the gain on the sale of Total Logistic Control of $62, or 0.7 percent of Supply chain services
sales.
20