Albertsons 2011 Annual Report Download - page 22
Download and view the complete annual report
Please find page 22 of the 2011 Albertsons annual report below. You can navigate through the pages in the report by either clicking on the pages listed below, or by using the keyword search tool below to find specific information within the annual report.-
 1
1 -
2
-
3
-
4
-
5
-
6
-
7
-
8
-
9
-
10
-
11
-
 12
12 -
 13
13 -
 14
14 -
 15
15 -
 16
16 -
 17
17 -
 18
18 -
 19
19 -
 20
20 -
 21
21 -
 22
22 -
 23
23 -
 24
24 -
 25
25 -
 26
26 -
 27
27 -
 28
28 -
 29
29 -
 30
30 -
 31
31 -
 32
32 -
33
-
34
-
35
-
36
-
37
-
38
-
39
-
40
-
41
-
42
-
43
-
44
-
45
-
46
-
47
-
48
-
49
-
50
-
51
-
52
-
53
-
54
-
55
-
56
-
57
-
58
-
59
-
60
-
61
-
62
-
63
-
64
-
65
-
66
-
67
-
68
-
69
-
70
-
71
-
72
-
73
-
74
-
75
-
76
-
77
-
78
-
79
-
80
-
81
-
82
-
83
-
84
-
85
-
86
-
87
-
88
-
89
-
90
-
91
-
92
 |
 |

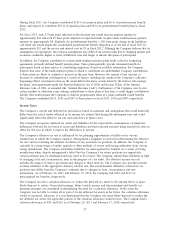
ITEM 6. SELECTED FINANCIAL DATA
(Dollars and shares in millions, except per
share data)
2011
(52 weeks)
2010
(52 weeks)
2009
(53 weeks)
2008
(52 weeks)
2007
(1)
(52 weeks)
Operating Results
Net sales $ 37,534 $ 40,597 $ 44,564 $ 44,048 $ 37,406
Identical store retail sales increase
(decrease)
(2)
(6.0)% (5.1)% (1.2)% 0.5% 0.4%
Cost of sales 29,124 31,444 34,451 33,943 29,267
Selling and administrative expenses 7,516 7,952 8,746 8,421 6,834
Goodwill and intangible asset impairment
charges
(3)
1,870 — 3,524 — —
Operating earnings (loss) (976) 1,201 (2,157) 1,684 1,305
Interest expense, net 547 569 622 707 558
Earnings (loss) before income taxes (1,523) 632 (2,779) 977 747
Income tax provision (benefit) (13) 239 76 384 295
Net earnings (loss) (1,510) 393 (2,855) 593 452
Net earnings (loss) as a percent of net sales (4.02)% 0.97% (6.41)% 1.35% 1.21%
Net earnings (loss) per share—diluted (7.13) 1.85 (13.51) 2.76 2.32
Financial Position
Inventories (FIFO)
(4)
$ 2,552 $ 2,606 $ 2,967 $ 2,956 $ 2,927
Working capital
(4)
(84) (192) (109) (280) (67)
Property, plant and equipment, net 6,604 7,026 7,528 7,533 8,415
Total assets 13,758 16,436 17,604 21,062 21,702
Debt and capital lease obligations 6,751 7,635 8,484 8,833 9,478
Stockholders’ equity 1,340 2,887 2,581 5,953 5,306
Other Statistics
Return on average stockholders’ equity (76.36)% 14.42% (59.32)% 10.44% 9.61%
Book value per share $ 6.32 $ 13.62 $ 12.19 $ 28.13 $ 25.40
Current ratio
(4)
0.98:1 0.95:1 0.98:1 0.94:1 0.99:1
Debt to capital ratio
(5)
83.4% 72.6% 76.7% 59.7% 64.1%
Dividends declared per share $ 0.3500 $ 0.6100 $ 0.6875 $ 0.6750 $ 0.6575
Weighted average shares
outstanding—diluted 212 213 211 215 196
Depreciation and amortization $ 925 $ 957 $ 1,057 $ 1,017 $ 879
Capital expenditures
(6)
$ 604 $ 691 $ 1,212 $ 1,227 $ 910
Retail stores as of fiscal year end
(7)
2,394 2,349 2,421 2,474 2,478
(1) Fiscal 2007 includes 38 weeks of operating results of the Acquired Operations as well as the assets and
liabilities of the Acquired Operations as of the end of fiscal 2007.
(2) The change in identical store sales is calculated as the change in net sales for stores operating for four
full quarters, including store expansions and excluding fuel and planned store dispositions. Fiscal 2008
and 2007 identical store sales is calculated as if the Acquired Operations stores were in the identical
store base for four full quarters in fiscal 2008, 2007 and 2006.
(3) The Company recorded goodwill and intangible asset impairment charges of $1,870 before tax ($1,743
after tax, or $8.23 per diluted share) in fiscal 2011 and $3,524 before tax ($3,326 after tax, or $15.71 per
diluted share) in fiscal 2009.
(4) Inventories (FIFO), working capital and current ratio are calculated after adding back the LIFO reserve.
The LIFO reserve for each year is as follows: $282 for fiscal 2011, $264 for fiscal 2010, $258 for fiscal
2009, $180 for fiscal 2008 and $178 for fiscal 2007.
(5) The debt to capital ratio is calculated as debt and capital lease obligations divided by the sum of debt
and capital lease obligations and stockholders’ equity. The increases in fiscal 2011 and fiscal 2009 are
due to the write-down of goodwill and intangible assets.
(6) Capital expenditures include fixed asset and capital lease additions.
(7) Retail stores as of fiscal year end includes licensed hard-discount food stores and is adjusted for planned
sales and closures as of the end of each fiscal year.
Historical data is not necessarily indicative of the Company’s future results of operations or financial
condition. See discussion of “Risk Factors” in Part I, Item 1A of this Annual Report on Form 10-K.
18