Albertsons 2011 Annual Report Download - page 26
Download and view the complete annual report
Please find page 26 of the 2011 Albertsons annual report below. You can navigate through the pages in the report by either clicking on the pages listed below, or by using the keyword search tool below to find specific information within the annual report.-
 1
1 -
2
-
3
-
4
-
5
-
6
-
7
-
8
-
9
-
10
-
11
-
12
-
13
-
14
-
15
-
 16
16 -
 17
17 -
 18
18 -
 19
19 -
 20
20 -
 21
21 -
 22
22 -
 23
23 -
 24
24 -
 25
25 -
 26
26 -
 27
27 -
 28
28 -
 29
29 -
 30
30 -
 31
31 -
 32
32 -
 33
33 -
 34
34 -
 35
35 -
 36
36 -
37
-
38
-
39
-
40
-
41
-
42
-
43
-
44
-
45
-
46
-
47
-
48
-
49
-
50
-
51
-
52
-
53
-
54
-
55
-
56
-
57
-
58
-
59
-
60
-
61
-
62
-
63
-
64
-
65
-
66
-
67
-
68
-
69
-
70
-
71
-
72
-
73
-
74
-
75
-
76
-
77
-
78
-
79
-
80
-
81
-
82
-
83
-
84
-
85
-
86
-
87
-
88
-
89
-
90
-
91
-
92
 |
 |
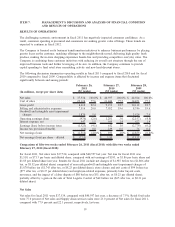
Total retail square footage as of the end of fiscal 2010 was approximately 65 million, a decrease of
6.2 percent from the end of fiscal 2009. Total retail square footage, excluding actual and planned store
dispositions, increased 0.8 percent from the end of fiscal 2009.
Supply chain services sales for fiscal 2010 were $8,960, compared with $9,900 in fiscal 2009. Approximately
$165 of fiscal 2009 Supply chain services sales is attributable to the extra week. The remaining decrease
primarily reflects the completion of a national retail customer’s previously announced plans to transition
certain volume to self-distribution.
Gross Profit
Gross profit, as a percent of Net sales, was 22.5 percent for fiscal 2010 compared with 22.7 percent in fiscal
2009, primarily reflecting a higher promotional sales mix and increased investments in price, partially offset
by a lower LIFO charge.
Selling and Administrative Expenses
Selling and administrative expenses, as a percent of Net sales, were 19.6 percent for fiscal 2010, compared
with 19.6 percent in fiscal 2009. Savings from ongoing cost-reduction initiatives and lower store disposition-
related costs compared to last year were offset by reduced sales leverage.
Goodwill and intangible asset impairment charges
No goodwill impairment charges were recorded in fiscal 2010. During fiscal 2009 the Company recorded
impairment charges of $3,524 in the Retail food segment due to the significant decline in the market price of
the Company’s common stock as of the end of the third quarter of fiscal 2009 as well as the impact of the
unprecedented decline in the economy on the Company’s plan.
Operating Earnings (Loss)
Operating earnings for fiscal 2010 were $1,201 compared with an operating loss of $2,157 in fiscal 2009.
Retail food operating earnings for fiscal 2010 were $989, or 3.1 percent of Retail food net sales, reflecting
$55, or 0.2 percent of Retail food net sales, of charges related to planned retail market exits. Retail food
operating loss for fiscal 2009 was $2,315, or negative 6.7 percent of Retail food net sales last year, reflecting
$3,524, or 10.2 percent of Retail food sales, of goodwill and intangible asset impairment charges and $162, or
0.5 percent of Retail food sales, of charges primarily related to the closure of non-strategic stores. The
remaining decrease of $327, or 70 basis points, primarily reflects the impact of a challenging economic
environment, heightened competitive activity, a higher promotional sales mix, increased investments in price
and reduced sales leverage, partially offset by a lower LIFO charge. Supply chain services operating earnings
for fiscal 2010 were $299, or 3.3 percent of Supply chain services net sales, compared with $307, or
3.1 percent of Supply chain services net sales, in fiscal 2009. The 20 basis point increase in Supply chain
services operating earnings as a percent of Supply chain services net sales primarily reflects a lower LIFO
charge and fees received from the early termination of a supply agreement in fiscal 2010.
Net Interest Expense
Net interest expense was $569 in fiscal 2010, compared with $622 in fiscal 2009, primarily reflecting lower
interest rates and debt levels as well as one less week in fiscal 2010.
Provision for Income Taxes
Income tax expense was $239, or 37.8 percent of earnings before income taxes, for fiscal 2010 compared with
$76, or 2.7 percent of loss before income taxes, in fiscal 2009. The tax rate for fiscal 2009 reflects the impact
of the goodwill and intangible asset impairment charges, the majority of which are non-deductible for income
tax purposes, as well as a benefit attributable to favorable state tax items, non-taxable life insurance proceeds
and a reduction in the statutory rate.
22