Albertsons 2006 Annual Report Download - page 69
Download and view the complete annual report
Please find page 69 of the 2006 Albertsons annual report below. You can navigate through the pages in the report by either clicking on the pages listed below, or by using the keyword search tool below to find specific information within the annual report.-
 1
1 -
2
-
3
-
4
-
5
-
6
-
7
-
8
-
9
-
10
-
11
-
12
-
13
-
14
-
15
-
16
-
17
-
18
-
19
-
20
-
21
-
22
-
23
-
24
-
25
-
26
-
27
-
28
-
29
-
30
-
31
-
32
-
33
-
34
-
35
-
36
-
37
-
38
-
39
-
40
-
41
-
42
-
43
-
44
-
45
-
46
-
47
-
48
-
49
-
50
-
51
-
52
-
53
-
54
-
55
-
56
-
57
-
58
-
 59
59 -
 60
60 -
 61
61 -
 62
62 -
 63
63 -
 64
64 -
 65
65 -
 66
66 -
 67
67 -
 68
68 -
 69
69 -
 70
70 -
 71
71 -
 72
72 -
 73
73 -
 74
74 -
 75
75 -
 76
76 -
 77
77 -
 78
78 -
 79
79 -
80
-
81
-
82
-
83
-
84
-
85
 |
 |

SUPERVALU INC. and Subsidiaries
NOTES TO CONSOLIDATED FINANCIAL STATEMENTS—(Continued)
Fair Value Disclosures of Financial Instruments
For certain of the company’s financial instruments, including cash and cash equivalents, receivables and
notes payable, the carrying amounts approximate fair value due to their short maturities.
The estimated fair value of notes receivable was in excess of the carrying value by approximately $0.1
million at February 25, 2006. Notes receivable are valued based on a discounted cash flow approach applying a
rate that is comparable to publicly traded debt instruments of similar credit quality.
The estimated fair value of the company’s long-term debt (including current maturities) was in excess of the
carrying value by approximately $35.8 million at February 25, 2006. The estimated fair value was based on
market quotes, where available, or market values for similar instruments.
The estimated fair value of the company’s interest rate swaps is the carrying value at February 25, 2006.
The fair value of interest rate swaps is the amount at which they could be settled and is estimated by obtaining
quotes from brokers.
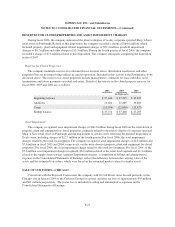
DEBT
Notes, debentures and other debt were composed of the following at year-end:
February 25,
2006
February 26,
2005
(In thousands)
7.875% promissory note due fiscal 2010 $ 350,000 $ 350,000
7.5% promissory note due fiscal 2013 300,000 300,000
Zero-coupon convertible debentures 258,548 247,325
6.64% medium-term notes due fiscal 2007 64,800 103,500
Variable rate industrial revenue bonds 51,680 59,530
8.28%-9.46% promissory notes due fiscal 2007-2011 10,543 15,252
8.02% and 8.57% obligations with quarterly payments of principal and
interest due fiscal 2007 2,401 18,495
Other debt 11,138 22,106
1,049,110 1,116,208
Less current maturities 74,650 64,320
Long-term debt $ 974,460 $1,051,888
Aggregate maturities of long-term debt are:
(In thousands)
2007 $ 74,650
2008 7,109
2009 12,042
2010 367,458
2011 and thereafter 587,851
F-24