Albertsons 2006 Annual Report Download - page 13
Download and view the complete annual report
Please find page 13 of the 2006 Albertsons annual report below. You can navigate through the pages in the report by either clicking on the pages listed below, or by using the keyword search tool below to find specific information within the annual report.-
 1
1 -
2
-
 3
3 -
 4
4 -
 5
5 -
 6
6 -
 7
7 -
 8
8 -
 9
9 -
 10
10 -
 11
11 -
 12
12 -
 13
13 -
 14
14 -
 15
15 -
 16
16 -
 17
17 -
 18
18 -
 19
19 -
 20
20 -
 21
21 -
 22
22 -
 23
23 -
24
-
25
-
26
-
27
-
28
-
29
-
30
-
31
-
32
-
33
-
34
-
35
-
36
-
37
-
38
-
39
-
40
-
41
-
42
-
43
-
44
-
45
-
46
-
47
-
48
-
49
-
50
-
51
-
52
-
53
-
54
-
55
-
56
-
57
-
58
-
59
-
60
-
61
-
62
-
63
-
64
-
65
-
66
-
67
-
68
-
69
-
70
-
71
-
72
-
73
-
74
-
75
-
76
-
77
-
78
-
79
-
80
-
81
-
82
-
83
-
84
-
85
 |
 |

PART II
ITEM 5. MARKET FOR THE REGISTRANT’S COMMON EQUITY, RELATED STOCKHOLDER
MATTERS AND ISSUER PURCHASES OF EQUITY SECURITIES
The company’s common stock is listed on the New York Stock Exchange under the symbol SVU. As of
May 1, 2006, there were 136,974,770 shares of common stock outstanding. At that date, there were 6,191
stockholders of record, excluding individual participants in security position listings. The information called for
by Item 5 as to the sales price for the company’s common stock on a quarterly basis during the last two fiscal
years and dividend information is found under the heading “Common Stock Price” in Part II, Item 7 of this
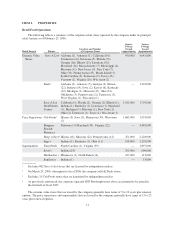
report. The following table sets forth the registrant’s purchase of equity securities for the periods indicated:
Period (1)
Total Number
of Shares
Purchased (2)
Average
Price Paid
Per Share
Total Number of
Shares Purchased
as Part of
Publicly
Announced
Treasury Stock
Purchase
Program (3)
Maximum Number
of Shares that May
Yet be Purchased
Under the
Treasury Stock
Purchase
Program (3)
First four weeks
December 4, 2005 to December 31, 2005 3,809 $32.73 — 3,693,300
Second four weeks
January 1, 2006 to January 28, 2006 22,356 $32.88 — 3,693,300
Third four weeks
January 29, 2006 to February 25, 2006 125,506 $31.49 — 3,693,300
Totals 151,671 $31.72 — 3,693,300
(1) The reported periods conform to the company’s fiscal calendar composed of thirteen 28-day periods. The
fourth quarter of fiscal 2006 contains three 28-day periods.
(2) These amounts include the deemed surrender by participants in the company’s compensatory stock plans of
151,671 shares of previously issued common stock in payment of the purchase price for shares acquired
pursuant to the exercise of stock options and satisfaction of tax obligations arising from such exercises as
well as from the vesting of restricted stock granted under such plans.
(3) On May 26, 2004, the company announced a treasury stock purchase program authorized by the Board of
Directors to repurchase up to 5,000,000 shares of the company’s common stock to offset the issuance of
shares over time under the company’s employee benefit plans. As of February 25, 2006, 3,693,300 shares
remained available for purchase under that program.
ITEM 6. SELECTED FINANCIAL DATA
The information called for by Item 6 is found within the Five Year Financial and Operating Summary on
page F-2.
ITEM 7. MANAGEMENT’S DISCUSSION AND ANALYSIS OF FINANCIAL CONDITION AND
RESULTS OF OPERATIONS
OVERVIEW
SUPERVALU is one of the largest grocery companies in the United States. We operate in two segments of
the grocery industry, retail food stores and supply chain services, which includes food distribution and related
logistics support services. At February 25, 2006, we conducted our retail operations through a total of 1,381
stores of which 862 are licensed locations. Store counts are adjusted for the planned sale of Deals and Shop ’n
Save Pittsburgh. Principal formats include extreme value stores, regional price superstores and regional
13