Albertsons 2006 Annual Report Download - page 16
Download and view the complete annual report
Please find page 16 of the 2006 Albertsons annual report below. You can navigate through the pages in the report by either clicking on the pages listed below, or by using the keyword search tool below to find specific information within the annual report.-
 1
1 -
2
-
3
-
4
-
5
-
 6
6 -
 7
7 -
 8
8 -
 9
9 -
 10
10 -
 11
11 -
 12
12 -
 13
13 -
 14
14 -
 15
15 -
 16
16 -
 17
17 -
 18
18 -
 19
19 -
 20
20 -
 21
21 -
 22
22 -
 23
23 -
 24
24 -
 25
25 -
 26
26 -
27
-
28
-
29
-
30
-
31
-
32
-
33
-
34
-
35
-
36
-
37
-
38
-
39
-
40
-
41
-
42
-
43
-
44
-
45
-
46
-
47
-
48
-
49
-
50
-
51
-
52
-
53
-
54
-
55
-
56
-
57
-
58
-
59
-
60
-
61
-
62
-
63
-
64
-
65
-
66
-
67
-
68
-
69
-
70
-
71
-
72
-
73
-
74
-
75
-
76
-
77
-
78
-
79
-
80
-
81
-
82
-
83
-
84
-
85
 |
 |
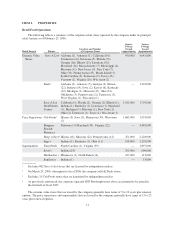
RESULTS OF OPERATIONS
Highlights of results of operations as reported and as a percent of net sales are as follows:
February 25,
2006
(52 weeks)
February 26,
2005
(52 weeks)
February 28,
2004
(53 weeks)
(In millions)
Net sales $19,863.6 100.0% $19,543.2 100.0% $20,209.7 100.0%
Cost of sales 16,977.3 85.5 16,681.5 85.4 17,372.4 85.9
Selling and administrative expenses 2,446.6 12.3 2,228.9 11.4 2,220.4 11.0
Gain on sale of WinCo Foods, Inc. — — (109.2) (0.6) — —
Restructure and other charges 4.5 — 26.4 0.1 15.5 0.1
Operating earnings $ 435.2 2.2 $ 715.6 3.7 $ 601.4 3.0
Interest expense 138.9 0.7 137.5 0.7 165.6 0.8
Interest income (32.9) (0.2) (22.7) (0.1) (19.1) (0.1)
Earnings before income taxes $ 329.2 1.7 $ 600.8 3.1 $ 454.9 2.3
Income tax expense 123.0 0.6 215.0 1.1 174.8 0.9
Net earnings $ 206.2 1.1% $ 385.8 2.0% $ 280.1 1.4%
Comparison of fifty-two weeks ended February 25, 2006 (fiscal 2006) with fifty-two weeks ended
February 26, 2005 (fiscal 2005):
In fiscal 2006, the company achieved net sales of $19.86 billion compared with $19.54 billion last year. Net
earnings for fiscal 2006 were $206.2 million, basic earnings per share were $1.52 and diluted earnings per share
were $1.46 compared with net earnings of $385.8 million, basic earnings per share of $2.86 and diluted earnings
per share of $2.71 last year. Results for fiscal 2006 include charges of approximately $61.2 million after-tax, or
$0.42 per diluted share related to the sale of Cub Foods stores in Chicago in January 2006 (“Chicago”), $38.1
million after-tax, or $0.26 per diluted share related to plans to dispose of twenty corporate operated Shop ‘n Save
retail stores in Pittsburgh announced in September 2005 (“Pittsburgh”), $8.7 million after-tax, or $0.06 per
diluted share related to asset impairment for technology investments in connection with the planned disposition
of stand-alone Deals stores announced in February 2006 (“Deals”) and approximately $3 million after-tax, or
$0.02 per diluted share related to impact of Hurricane Katrina primarily at Save-A-Lot locations in Louisiana
(“Hurricane”). Results for fiscal 2005 year-to-date include a net after-tax gain on the sale of the company’s
minority interest in WinCo Foods, Inc. (“WinCo”), a privately held grocery chain that operates stores primarily
in the northwestern United States, of $68.3 million or $0.51 basic earnings per share and $0.47 diluted earnings
per share.
Net Sales
Net sales for fiscal 2006 were $19.86 billion compared with $19.54 billion last year, an increase of $0.32
billion or 1.6 percent compared with last year. Retail food sales were approximately 53.5 percent of net sales and
supply chain services sales were approximately 46.5 percent of net sales for fiscal 2006, compared to 54.0
percent and 46.0 percent, respectively last year.
Retail food sales for fiscal 2006 were $10.6 billion, an increase of $0.1 billion or 0.8 percent from last year.
The increase primarily reflects net new store growth, which was partially offset by negative same store sales. For
fiscal 2006, same-store retail sales, defined as stores operating for four full quarters, including store expansions,
decreased 0.5 percent.
16