Albertsons 2006 Annual Report Download - page 56
Download and view the complete annual report
Please find page 56 of the 2006 Albertsons annual report below. You can navigate through the pages in the report by either clicking on the pages listed below, or by using the keyword search tool below to find specific information within the annual report.-
 1
1 -
2
-
3
-
4
-
5
-
6
-
7
-
8
-
9
-
10
-
11
-
12
-
13
-
14
-
15
-
16
-
17
-
18
-
19
-
20
-
21
-
22
-
23
-
24
-
25
-
26
-
27
-
28
-
29
-
30
-
31
-
32
-
33
-
34
-
35
-
36
-
37
-
38
-
39
-
40
-
41
-
42
-
43
-
44
-
45
-
 46
46 -
 47
47 -
 48
48 -
 49
49 -
 50
50 -
 51
51 -
 52
52 -
 53
53 -
 54
54 -
 55
55 -
 56
56 -
 57
57 -
 58
58 -
 59
59 -
 60
60 -
 61
61 -
 62
62 -
 63
63 -
 64
64 -
 65
65 -
 66
66 -
67
-
68
-
69
-
70
-
71
-
72
-
73
-
74
-
75
-
76
-
77
-
78
-
79
-
80
-
81
-
82
-
83
-
84
-
85
 |
 |

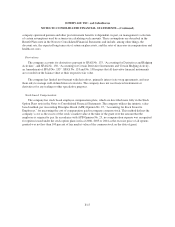
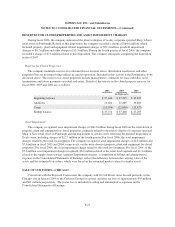
SUPERVALU INC. and Subsidiaries
CONSOLIDATED STATEMENTS OF CASH FLOWS
(In thousands)
February 25,
2006
(52 weeks)
February 26,
2005
(52 weeks)
February 28,
2004
(53 weeks)
Cash flows from operating activities
Net earnings $ 206,169 $ 385,823 $ 280,138
Adjustments to reconcile net earnings to net cash provided by operating
activities:
Gain on sale of WinCo Foods, Inc. — (109,238) —
Loss on sale of Cub Chicago 94,531 — —
Restructure and other charges 4,455 26,416 15,523
Impairment charges 72,952 — —
Depreciation and amortization 310,678 303,039 301,589
LIFO expense 13,153 6,112 4,734
Provision for losses on receivables 3,467 10,338 10,479
Loss (gain) on sale of property, plant and equipment 5,564 7,445 (1,802)
Deferred income taxes (61,237) 48,962 38,761
Equity in (earnings) losses of unconsolidated subsidiaries 616 (14,325) (39,215)
Other adjustments, net 5,621 3,154 4,339
Changes in assets and liabilities, net of effects from acquisition and
dispositions of businesses:
Receivables 19,009 22,429 23,407
Inventories 28,177 34,943 (19,331)
Long-term notes receivable, net 3,229 24,880 14,620
Accounts payable (82,265) 22,610 1,361
Income taxes currently payable (21,476) (67,449) 82,781
Other assets and liabilities 71,414 86,427 129,442
Net cash provided by operating activities 674,057 791,566 846,826
Cash flows from investing activities
Proceeds from sale of assets 49,430 34,896 56,552
Proceeds from sale of WinCo Foods, Inc. — 229,846 —
Purchases of property, plant and equipment (307,906) (262,790) (328,156)
Purchase of Total Logistics, Inc. — (163,766) —
Net cash used in investing activities (258,476) (161,814) (271,604)
Cash flows from financing activities
Net (reduction) issuance of notes payable — — (80,000)
Proceeds from issuance of long-term debt — 3,813 —
Repayment of long-term debt (69,813) (331,798) (131,063)
Reduction of obligations under capital leases (34,564) (33,004) (32,884)
Dividends paid (85,775) (80,220) (77,035)
Net proceeds from the sale of common stock under option plans 25,567 39,375 23,127
Payment for purchase of treasury shares (28,812) (55,959) (14,599)
Net cash used in financing activities (193,397) (457,793) (312,454)
Net increase in cash and cash equivalents 222,184 171,959 262,768
Cash and cash equivalents at beginning of year 463,915 291,956 29,188
Cash and cash equivalents at end of year $ 686,099 $ 463,915 $ 291,956
F-11