3M 2008 Annual Report Download - page 84
Download and view the complete annual report
Please find page 84 of the 2008 3M annual report below. You can navigate through the pages in the report by either clicking on the pages listed below, or by using the keyword search tool below to find specific information within the annual report.-
 1
1 -
2
-
3
-
4
-
5
-
6
-
7
-
8
-
9
-
10
-
11
-
12
-
13
-
14
-
15
-
16
-
17
-
18
-
19
-
20
-
21
-
22
-
23
-
24
-
25
-
26
-
27
-
28
-
29
-
30
-
31
-
32
-
33
-
34
-
35
-
36
-
37
-
38
-
39
-
40
-
41
-
42
-
43
-
44
-
45
-
46
-
47
-
48
-
49
-
50
-
51
-
52
-
53
-
54
-
55
-
56
-
57
-
58
-
59
-
60
-
61
-
62
-
63
-
64
-
65
-
66
-
67
-
68
-
69
-
70
-
71
-
72
-
73
-
 74
74 -
 75
75 -
 76
76 -
 77
77 -
 78
78 -
 79
79 -
 80
80 -
 81
81 -
 82
82 -
 83
83 -
 84
84 -
 85
85 -
 86
86 -
 87
87 -
 88
88 -
 89
89 -
 90
90 -
 91
91 -
 92
92 -
 93
93 -
 94
94 -
95
-
96
-
97
-
98
-
99
-
100
-
101
-
102
-
103
-
104
-
105
-
106
-
107
-
108
-
109
-
110
-
111
-
112
 |
 |

78
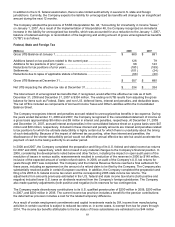
performance benefited significantly from the long duration instruments. The average annual actual return on the plan
assets over the past 10 and 25 years has been 5.7% and 10.9%, respectively.
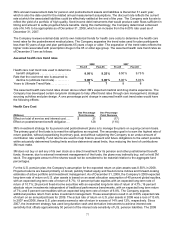
The U.S. plan’s asset allocation by asset category as of plan measurement dates follows:
Target
Percentage
of Plan Assets
Asset Category Allocation 2008 2007
U.S. qualified pension plan
Global equity............................................. 40 % 28 % 45 %
Fixed income ............................................ 26 34 23
Private equity ............................................ 13 18 16
Absolute return ......................................... 16 17 11
Commodities............................................. 5 1
4
Cash ......................................................... — 2
1
Total ...................................................... 100 % 100 % 100 %
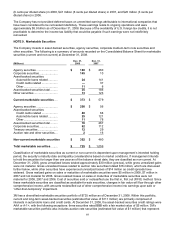
Postretirement benefits
Global equity............................................. 46 % 53 % 75 %
Fixed income ............................................ 35 23 9
Private equity ............................................ 14 17 13
Absolute return ......................................... 4 4
2
Commodities............................................. 1 1
1
Cash ......................................................... — 2 —
Total ...................................................... 100 % 100 % 100 %
While the target asset allocations do not have a percentage allocated to cash, the plans will always have some cash
due to cash flows. The postretirement allocation shown above represents a weighted-average allocation for U.S.
plans.
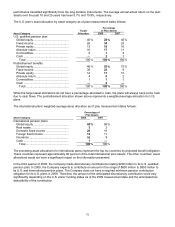
The international plans’ weighted-average asset allocation as of plan measurement dates follows:
Percentage of
Plan Assets
Asset Category 2008 2007
International pension plans
Global equity............................................. 45 % 58 %
Real estate................................................ 3
3
Domestic fixed income ............................. 20 19
Foreign fixed income ................................ 15 11
Insurance .................................................. 16 9
Cash ......................................................... 1 —
Total ...................................................... 100 % 100 %
The preceding asset allocations for international plans represent the top six countries by projected benefit obligation.
These countries represent approximately 90 percent of the total international plan assets. The other countries’ asset
allocations would not have a significant impact on the information presented.
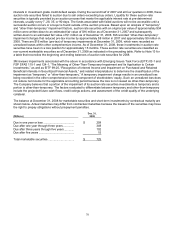
In the third quarter of 2008, the Company made discretionary contributions totaling $200 million to its U.S. qualified
pension plan. In 2009, the Company expects to contribute an amount in the range of $600 million to $850 million to
its U.S. and international pension plans. The Company does not have a required minimum pension contribution
obligation for its U.S. plans in 2009. Therefore, the amount of the anticipated discretionary contribution could vary
significantly depending on the U.S. plans’ funding status as of the 2009 measurement date and the anticipated tax
deductibility of the contribution.