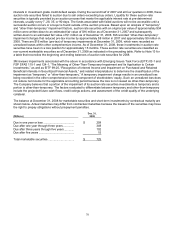
3M 2008 Annual Report Download - page 82
Download and view the complete annual report
Please find page 82 of the 2008 3M annual report below. You can navigate through the pages in the report by either clicking on the pages listed below, or by using the keyword search tool below to find specific information within the annual report.-
 1
1 -
2
-
3
-
4
-
5
-
6
-
7
-
8
-
9
-
10
-
11
-
12
-
13
-
14
-
15
-
16
-
17
-
18
-
19
-
20
-
21
-
22
-
23
-
24
-
25
-
26
-
27
-
28
-
29
-
30
-
31
-
32
-
33
-
34
-
35
-
36
-
37
-
38
-
39
-
40
-
41
-
42
-
43
-
44
-
45
-
46
-
47
-
48
-
49
-
50
-
51
-
52
-
53
-
54
-
55
-
56
-
57
-
58
-
59
-
60
-
61
-
62
-
63
-
64
-
65
-
66
-
67
-
68
-
69
-
70
-
71
-
 72
72 -
 73
73 -
 74
74 -
 75
75 -
 76
76 -
 77
77 -
 78
78 -
 79
79 -
 80
80 -
 81
81 -
 82
82 -
 83
83 -
 84
84 -
 85
85 -
 86
86 -
 87
87 -
 88
88 -
 89
89 -
 90
90 -
 91
91 -
 92
92 -
93
-
94
-
95
-
96
-
97
-
98
-
99
-
100
-
101
-
102
-
103
-
104
-
105
-
106
-
107
-
108
-
109
-
110
-
111
-
112
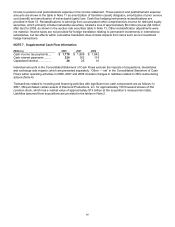
 |
 |

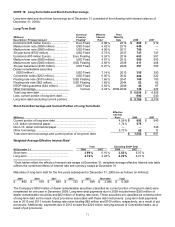
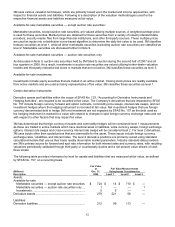
76
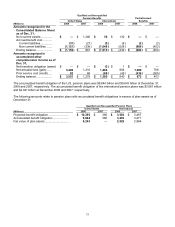
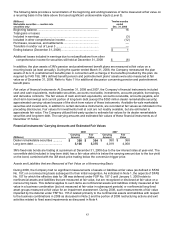
Components of net periodic benefit cost and other supplemental information for the years ended December 31
follow:
Components of net periodic benefit cost and other amounts recognized in other comprehensive income
Qualified and Non-qualified
Pension Benefits Postretirement
United States International Benefits
(Millions) 2008 2007 2006 2008 2007 2006 2008 2007 2006
Net periodic benefit cost
Service cost ..................... $ 192
$ 192 $ 196 $ 120 $ 125 $ 124
$ 53
$57 $58
Interest cost ..................... 597
568 539 252 228 183
100
104 104
Expected return on plan
assets........................... (889 ) (840 ) (764 ) (305 ) (290 ) (245 ) (104 ) (107 ) (103 )
Amortization of transition
(asset) obligation.......... —
— — 3
3 3
—
— —
Amortization of prior
service cost (benefit).... 15
14 13 (2 ) (2 ) (3 ) (97 ) (72 ) (50 )
Amortization of net
actuarial (gain) loss...... 58
126 202 38 55 63
64
74 84
Net periodic benefit cost...... $ (27 ) $ 60 $ 186 $ 106 $ 119 $ 125
$ 16
$56 $93
Settlements, curtailments,
special termination
benefits and other............ 7
7 32 3
4 4
—
9 —
Net periodic benefit cost
after settlements,
curtailments, special
termination benefits and
other................................. $ (20 ) $ 67 $ 218 $ 109 $ 123 $ 129
$ 16
$65 $93
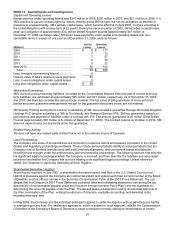
The estimated amortization from accumulated other comprehensive income into net periodic benefit cost in 2009
follows:
Amounts expected to be amortized from accumulated other comprehensive income into net periodic benefit
costs over next fiscal year
Qualified and Non-qualified
Pension Benefits
(Millions)
United
States International
Postretirement
Benefits
Amortization of transition (asset) obligation .................... $ — $ 3 $ —
Amortization of prior service cost (benefit)...................... 16 (5 ) (81 )
Amortization of net actuarial (gain) loss .......................... 96 42 73
$ 112 $ 40 $ (8 )
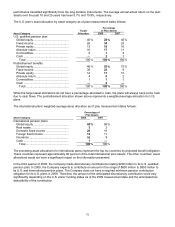
Other supplemental information for the years ended December 31 follows:
Weighted-average assumptions used to determine benefit obligations
Qualified and Non-qualified Pension Benefits Postretirement
United States International Benefits
2008 2007 2006 2008 2007 2006 2008 2007 2006
Discount rate .......... 6.14 % 6.00 % 5.75 % 5.53 % 5.39 % 4.88 % 6.14 % 6.00 % 5.75 %
Compensation rate increase 4.30 % 4.30 % 4.30 % 3.50 % 3.82 % 3.67 % N/A
N/A N/A
Weighted-average assumptions used to determine net cost for years ended
2008 2007 2006 2008 2007 2006 2008 2007 2006
Discount rate ........................... 6.00 % 5.75 % 5.50 % 5.39 % 4.88 % 4.50 % 6.00 % 5.75 % 5.50 %
Expected return on assets ...... 8.50 % 8.75 % 8.75 % 7.19 % 7.19 % 7.20 % 8.60 % 8.60 % 8.60 %
Compensation rate increase ... 4.30 % 4.30 % 4.30 % 3.82 % 3.67 % 3.52 % N/A
N/A N/A