3M 2008 Annual Report Download - page 103
Download and view the complete annual report
Please find page 103 of the 2008 3M annual report below. You can navigate through the pages in the report by either clicking on the pages listed below, or by using the keyword search tool below to find specific information within the annual report.-
 1
1 -
2
-
3
-
4
-
5
-
6
-
7
-
8
-
9
-
10
-
11
-
12
-
13
-
14
-
15
-
16
-
17
-
18
-
19
-
20
-
21
-
22
-
23
-
24
-
25
-
26
-
27
-
28
-
29
-
30
-
31
-
32
-
33
-
34
-
35
-
36
-
37
-
38
-
39
-
40
-
41
-
42
-
43
-
44
-
45
-
46
-
47
-
48
-
49
-
50
-
51
-
52
-
53
-
54
-
55
-
56
-
57
-
58
-
59
-
60
-
61
-
62
-
63
-
64
-
65
-
66
-
67
-
68
-
69
-
70
-
71
-
72
-
73
-
74
-
75
-
76
-
77
-
78
-
79
-
80
-
81
-
82
-
83
-
84
-
85
-
86
-
87
-
88
-
89
-
90
-
91
-
92
-
 93
93 -
 94
94 -
 95
95 -
 96
96 -
 97
97 -
 98
98 -
 99
99 -
 100
100 -
 101
101 -
 102
102 -
 103
103 -
 104
104 -
 105
105 -
 106
106 -
 107
107 -
 108
108 -
 109
109 -
 110
110 -
 111
111 -
 112
112
 |
 |

97
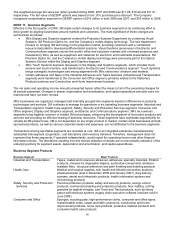
Business Segment Major Products
Display and Graphics
Optical films solutions for electronic displays, reflective sheeting for transportation
safety, commercial graphics systems, and projection systems, including mobile
display technology and visual systems
Electro and Communications
Packaging and interconnection devices, insulating and splicing solutions for the
electronics, telecommunications and electrical industries, and touch screens and
touch monitors
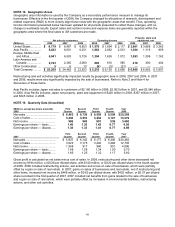
Business Segment Information
Net Sales Operating Income
(Millions) 2008 2007 2006 2008 2007 2006
Industrial and Transportation $ 7,818
$ 7,266 $ 6,632 $ 1,477 $ 1,497 $ 1,338
Health Care ......................... 4,293
3,968 4,011 1,173 1,882 1,845
Safety, Security and
Protection Services.......... 3,642
3,070 2,663 736 611 549
Consumer and Office .......... 3,448
3,411 3,172 663 692 633
Display and Graphics .......... 3,255
3,904 3,747 580 1,163 1,045
Electro and Communications 2,791
2,763 2,654 531 492 410
Corporate and Unallocated . 22
80 44 58 (144 ) (124 )
Total Company .................... $ 25,269
$ 24,462 $ 22,923 $ 5,218 $ 6,193 $ 5,696
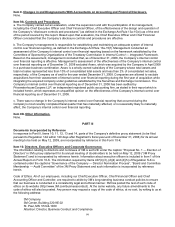
Assets Depreciation & Amortization Capital Expenditures
(Millions) 2008 2007 2006 2008 2007 2006 2008 2007 2006
Industrial and
Transportation.............. $ 6,202
$ 5,872 $ 5,180 $ 312 $ 294 $ 287
$ 395
$ 396 $ 284
Health Care ..................... 3,096
2,909 2,477 161 138 162
210
213 159
Safety, Security and
Protection Services...... 3,326
2,344 2,061
170 161 120 180
205 151
Consumer and Office ...... 1,786
1,720 1,577 86 82 77
107
101 103
Display and Graphics ...... 3,479
3,199 3,035 243 222 232
379
341 323
Electro and
Communications .......... 2,186
2,063 2,003 141 146 173
177
136 117
Corporate and
Unallocated.................. 5,472
6,587 4,961 40 29 28
23
30 31
Total Company ................ $ 25,547
$ 24,694 $ 21,294 $ 1,153 $ 1,072 $ 1,079
$ 1,471
$ 1,422 $ 1,168
Segment assets for the operating business segments (excluding Corporate and Unallocated) primarily include
accounts receivable; inventory; property, plant and equipment — net; goodwill and intangible assets; and other
miscellaneous assets. Assets included in Corporate and Unallocated principally are cash, cash equivalents and
marketable securities; insurance receivables; deferred income taxes; certain investments and other assets, including
prepaid pension assets. Corporate and unallocated assets can change from year to year due to changes in cash,
cash equivalents and marketable securities, changes in prepaid pension benefits, and changes in other unallocated
asset categories. For management reporting purposes, corporate goodwill (which at December 31, 2008, totaled
$487 million) is not allocated to the six operating business segments. In Note 3, corporate goodwill has been
allocated to the respective market segments as required by SFAS No. 142 for impairment testing.
Corporate and Unallocated operating income includes a variety of miscellaneous items, such as corporate investment
gains and losses, certain derivative gains and losses, insurance-related gains and losses, certain litigation and
environmental expenses, corporate restructuring charges and certain under- or over-absorbed costs (e.g. pension)
that the Company may choose not to allocate directly to its business segments. Because this category includes a
variety of miscellaneous items, it is subject to fluctuation on a quarterly and annual basis.
The most significant items impacting 2008 results were restructuring actions and exit activities. The most significant
items impacting both 2007 and 2006 results are the net gain on sale of the pharmaceuticals business (within the
Health Care segment) and restructuring and other actions. Refer to Note 2 for discussion of divestitures and Note 4
for discussion of restructuring actions and exit activities.