3M 2008 Annual Report Download - page 104
Download and view the complete annual report
Please find page 104 of the 2008 3M annual report below. You can navigate through the pages in the report by either clicking on the pages listed below, or by using the keyword search tool below to find specific information within the annual report.-
 1
1 -
2
-
3
-
4
-
5
-
6
-
7
-
8
-
9
-
10
-
11
-
12
-
13
-
14
-
15
-
16
-
17
-
18
-
19
-
20
-
21
-
22
-
23
-
24
-
25
-
26
-
27
-
28
-
29
-
30
-
31
-
32
-
33
-
34
-
35
-
36
-
37
-
38
-
39
-
40
-
41
-
42
-
43
-
44
-
45
-
46
-
47
-
48
-
49
-
50
-
51
-
52
-
53
-
54
-
55
-
56
-
57
-
58
-
59
-
60
-
61
-
62
-
63
-
64
-
65
-
66
-
67
-
68
-
69
-
70
-
71
-
72
-
73
-
74
-
75
-
76
-
77
-
78
-
79
-
80
-
81
-
82
-
83
-
84
-
85
-
86
-
87
-
88
-
89
-
90
-
91
-
92
-
93
-
 94
94 -
 95
95 -
 96
96 -
 97
97 -
 98
98 -
 99
99 -
 100
100 -
 101
101 -
 102
102 -
 103
103 -
 104
104 -
 105
105 -
 106
106 -
 107
107 -
 108
108 -
 109
109 -
 110
110 -
 111
111 -
 112
112
 |
 |

98
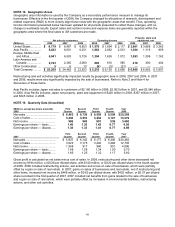
NOTE 18. Geographic Areas
Geographic area information is used by the Company as a secondary performance measure to manage its
businesses. Effective in the first quarter of 2008, the Company changed its allocations of research, development and
related expenses (R&D) to more closely align these costs with the geographic areas that benefit. Thus, operating
income information presented below has been updated for all periods presented to reflect these changes, with no
change in worldwide results. Export sales and certain income and expense items are generally reported within the
geographic area where the final sales to 3M customers are made.
Net sales to customers Operating Income
Property, plant and
equipment, net
(Millions) 2008 2007 2006 2008 2007 2006 2008 2007 2006
United States............. $ 9,179
$ 8,987 $ 8,853 $ 1,578 $ 1,894 $ 2,117
$ 3,901
$ 3,668 $ 3,382
Asia Pacific................ 6,423
6,601 6,251 1,662 2,062 2,013
1,304
1,116 959
Europe, Middle East
and Africa............... 6,941
6,503 5,726 1,294 1,626 1,012
1,263
1,308 1,162
Latin America and
Canada .................. 2,723
2,365 2,080 693 616 585
418
490 404
Other Unallocated ..... 3
6 13 (9) (5 ) (31 ) — — —
Total Company .......... $ 25,269
$ 24,462 $ 22,923 $ 5,218 $ 6,193 $ 5,696
$ 6,886
$ 6,582 $ 5,907
Restructuring and exit activities significantly impacted results by geographic area in 2008, 2007 and 2006. In 2007
and 2006, results were also significantly impacted by the sale of businesses. Refer to Note 2 and Note 4 for
discussion of these items.
Asia Pacific includes Japan net sales to customers of $2.180 billion in 2008, $2.063 billion in 2007, and $2.048 billion
in 2006. Asia Pacific includes Japan net property, plant and equipment of $420 million in 2008, $357 million in 2007,
and $345 million in 2006.
NOTE 19. Quarterly Data (Unaudited)
(Millions, except per-share amounts) First Second Third Fourth Year
2008 Quarter Quarter Quarter Quarter 2008
Net sales ..................................... $ 6,463 $ 6,739 $ 6,558 $ 5,509 $ 25,269
Cost of sales................................ 3,336 3,510 3,432 3,101 13,379
Net income .................................. 988 945 991 536 3,460
Earnings per share — basic........ 1.40 1.35 1.43 0.77 4.95
Earnings per share — diluted...... 1.38 1.33 1.41 0.77 4.89
First Second Third Fourth Year
2007 Quarter Quarter Quarter Quarter 2007
Net sales ..................................... $ 5,937 $ 6,142 $ 6,177 $ 6,206 $ 24,462
Cost of sales................................ 3,022 3,175 3,240 3,298 12,735
Net income .................................. 1,368 917 960 851 4,096
Earnings per share — basic........ 1.88 1.28 1.34 1.20 5.70
Earnings per share — diluted...... 1.85 1.25 1.32 1.17 5.60
Gross profit is calculated as net sales minus cost of sales. In 2008, restructuring and other items decreased net
income by $194 million, or $0.28 per diluted share, with $140 million, or $0.20 per diluted share in the fourth quarter
of 2008. 2008 included restructuring actions, exit activities and a loss on sale of businesses, which were partially
offset by a gain on sale of real estate. In 2007, gains on sales of businesses and real estate, net of restructuring and
other items, increased net income by $448 million, or $0.62 per diluted share, with $422 million, or $0.57 per diluted
share recorded in the first quarter of 2007. 2007 included net benefits from gains related to the sale of businesses
and a gain on sale of real estate, which were partially offset by increases in environmental liabilities, restructuring
actions, and other exit activities.