3M 2008 Annual Report Download - page 100
Download and view the complete annual report
Please find page 100 of the 2008 3M annual report below. You can navigate through the pages in the report by either clicking on the pages listed below, or by using the keyword search tool below to find specific information within the annual report.-
 1
1 -
2
-
3
-
4
-
5
-
6
-
7
-
8
-
9
-
10
-
11
-
12
-
13
-
14
-
15
-
16
-
17
-
18
-
19
-
20
-
21
-
22
-
23
-
24
-
25
-
26
-
27
-
28
-
29
-
30
-
31
-
32
-
33
-
34
-
35
-
36
-
37
-
38
-
39
-
40
-
41
-
42
-
43
-
44
-
45
-
46
-
47
-
48
-
49
-
50
-
51
-
52
-
53
-
54
-
55
-
56
-
57
-
58
-
59
-
60
-
61
-
62
-
63
-
64
-
65
-
66
-
67
-
68
-
69
-
70
-
71
-
72
-
73
-
74
-
75
-
76
-
77
-
78
-
79
-
80
-
81
-
82
-
83
-
84
-
85
-
86
-
87
-
88
-
89
-
 90
90 -
 91
91 -
 92
92 -
 93
93 -
 94
94 -
 95
95 -
 96
96 -
 97
97 -
 98
98 -
 99
99 -
 100
100 -
 101
101 -
 102
102 -
 103
103 -
 104
104 -
 105
105 -
 106
106 -
 107
107 -
 108
108 -
 109
109 -
 110
110 -
111
-
112
 |
 |

94
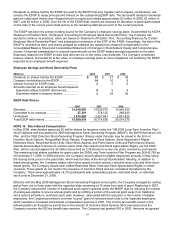
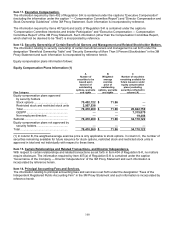
in the financial statements with respect to stock-based compensation programs, which include stock options,
restricted stock, restricted stock units and the General Employees’ Stock Purchase Plan (GESPP), are as follows:
Stock-Based Compensation Expense
Years ended December 31
(Millions, except per share amounts) 2008 2007 2006
Cost of sales.................................................... $43
$47 $ 42
Selling, general and administrative expenses 122 137 119
Research, development and related expenses 37 44 39
Operating Income (Loss)................................. $ (202 ) $ (228 ) $ (200 )
Income tax benefits ......................................... $71
$93 $ 72
Net Income (Loss) ........................................... $ (131) $ (135 ) $ (128 )
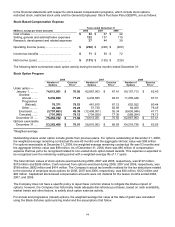
The following table summarizes stock option activity during the twelve months ended December 31:
Stock Option Program
2008 2007 2006
Number of Exercise Number of Exercise Number of Exercise
Options Price* Options Price* Options Price*
Under option —
January 1 ........... 74,613,051 $ 70.50 82,867,903 $ 67.41 80,157,713 $ 62.40
Granted
Annual ........ 5,239,660 77.22 4,434,583 84.81 11,255,448 87.31
Progressive
(Reload) .. 78,371 79.53 461,815 87.12 652,552 80.44
Other........... 20,389 79.25 51,730 82.93 84,400 76.45
Exercised ....... (3,797,663 ) 49.38 (12,498,051 ) 55.34 (8,693,946 ) 47.71
Canceled ........ (701,086 ) 79.12 (704,929 ) 77.36 (588,264 ) 74.72
December 31 ..... 75,452,722 $ 71.96 74,613,051 $ 70.50 82,867,903 $ 67.41
Options exercisable
December 31 ..... 63,282,408 $ 70.01 58,816,963 $ 66.83 64,218,738 $ 62.85
*Weighted average
Outstanding shares under option include grants from previous plans. For options outstanding at December 31, 2008,
the weighted-average remaining contractual life was 60 months and the aggregate intrinsic value was $98 million.
For options exercisable at December 31, 2008, the weighted-average remaining contractual life was 53 months and
the aggregate intrinsic value was $98 million. As of December 31, 2008, there was $80 million of compensation
expense that has yet to be recognized related to non-vested stock option-based awards. This expense is expected to
be recognized over the remaining vesting period with a weighted-average life of 1.7 years.
The total intrinsic values of stock options exercised during 2008, 2007 and 2006, respectively, was $107 million,
$373 million and $289 million. Cash received from options exercised during 2008, 2007 and 2006, respectively, was
$188 million, $692 million and $414 million. The Company’s actual tax benefits realized for the tax deductions related
to the exercise of employee stock options for 2008, 2007 and 2006, respectively, was $34 million, $122 million and
$93 million. Capitalized stock-based compensation amounts were not material for the twelve months ended 2008,
2007, and 2006.
The Company does not have a specific policy to repurchase common shares to mitigate the dilutive impact of
options; however, the Company has historically made adequate discretionary purchases, based on cash availability,
market trends and other factors, to satisfy stock option exercise activity.
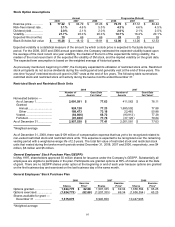
For annual and progressive (reload) options, the weighted average fair value at the date of grant was calculated
using the Black-Scholes option-pricing model and the assumptions that follow.