3M 2008 Annual Report Download - page 52
Download and view the complete annual report
Please find page 52 of the 2008 3M annual report below. You can navigate through the pages in the report by either clicking on the pages listed below, or by using the keyword search tool below to find specific information within the annual report.-
 1
1 -
2
-
3
-
4
-
5
-
6
-
7
-
8
-
9
-
10
-
11
-
12
-
13
-
14
-
15
-
16
-
17
-
18
-
19
-
20
-
21
-
22
-
23
-
24
-
25
-
26
-
27
-
28
-
29
-
30
-
31
-
32
-
33
-
34
-
35
-
36
-
37
-
38
-
39
-
40
-
41
-
 42
42 -
 43
43 -
 44
44 -
 45
45 -
 46
46 -
 47
47 -
 48
48 -
 49
49 -
 50
50 -
 51
51 -
 52
52 -
 53
53 -
 54
54 -
 55
55 -
 56
56 -
 57
57 -
 58
58 -
 59
59 -
 60
60 -
 61
61 -
 62
62 -
63
-
64
-
65
-
66
-
67
-
68
-
69
-
70
-
71
-
72
-
73
-
74
-
75
-
76
-
77
-
78
-
79
-
80
-
81
-
82
-
83
-
84
-
85
-
86
-
87
-
88
-
89
-
90
-
91
-
92
-
93
-
94
-
95
-
96
-
97
-
98
-
99
-
100
-
101
-
102
-
103
-
104
-
105
-
106
-
107
-
108
-
109
-
110
-
111
-
112
 |
 |

46
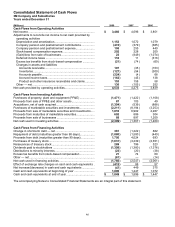
Consolidated Statement of Cash Flows
3M Company and Subsidiaries
Years ended December 31
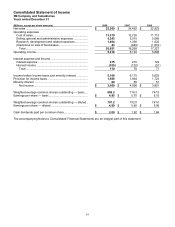
(Millions) 2008 2007 2006
Cash Flows from Operating Activities
Net income .................................................................................... $ 3,460 $ 4,096 $ 3,851
Adjustments to reconcile net income to net cash provided by
operating activities
Depreciation and amortization................................................... 1,153 1,072 1,079
Company pension and postretirement contributions................. (474 ) (379 ) (385 )
Company pension and postretirement expense........................ 105 255 440
Stock-based compensation expense......................................... 202 228 200
(Gain)/loss from sale of businesses .......................................... 23 (849 ) (1,074 )
Deferred income taxes .............................................................. 118 11 (316 )
Excess tax benefits from stock-based compensation ............... (21 ) (74 ) (60 )
Changes in assets and liabilities
Accounts receivable............................................................... 197 (35 ) (103 )
Inventories.............................................................................. (127 ) (54 ) (309 )
Accounts payable................................................................... (224 ) (4 ) 68
Accrued income taxes............................................................ (162 ) (45 ) 138
Product and other insurance receivables and claims ............ 153 158 58
Other — net ............................................................................... 130 (105 ) 252
Net cash provided by operating activities...................................... 4,533 4,275 3,839
Cash Flows from Investing Activities
Purchases of property, plant and equipment (PP&E) ................... (1,471 ) (1,422 ) (1,168 )
Proceeds from sale of PP&E and other assets............................. 87 103 49
Acquisitions, net of cash acquired................................................. (1,394 ) (539 ) (888 )
Purchases of marketable securities and investments................... (2,211 ) (8,194 ) (3,253 )
Proceeds from sale of marketable securities and investments..... 1,810 6,902 2,287
Proceeds from maturities of marketable securities ....................... 692 886 304
Proceeds from sale of businesses ................................................ 88 897 1,209
Net cash used in investing activities ............................................. (2,399 ) (1,367 ) (1,460 )
Cash Flows from Financing Activities
Change in short-term debt — net.................................................. 361 (1,222 ) 882
Repayment of debt (maturities greater than 90 days)................... (1,080 ) (1,580 ) (440 )
Proceeds from debt (maturities greater than 90 days).................. 1,756 4,024 693
Purchases of treasury stock.......................................................... (1,631 ) (3,239 ) (2,351 )
Reissuances of treasury stock ...................................................... 289 796 523
Dividends paid to stockholders ..................................................... (1,398 ) (1,380 ) (1,376 )
Distributions to minority interests .................................................. (23 ) (20 ) (38 )
Excess tax benefits from stock-based compensation ................... 21 74 60
Other — net................................................................................... (61 ) — (14 )
Net cash used in financing activities ............................................. (1,766 ) (2,547 ) (2,061 )
Effect of exchange rate changes on cash and cash equivalents . (415 ) 88 57
Net increase/(decrease) in cash and cash equivalents ................ (47 ) 449 375
Cash and cash equivalents at beginning of year .......................... 1,896 1,447 1,072
Cash and cash equivalents at end of year.................................... $ 1,849 $ 1,896 $ 1,447
The accompanying Notes to Consolidated Financial Statements are an integral part of this statement.