3M 2008 Annual Report Download - page 55
Download and view the complete annual report
Please find page 55 of the 2008 3M annual report below. You can navigate through the pages in the report by either clicking on the pages listed below, or by using the keyword search tool below to find specific information within the annual report.-
 1
1 -
2
-
3
-
4
-
5
-
6
-
7
-
8
-
9
-
10
-
11
-
12
-
13
-
14
-
15
-
16
-
17
-
18
-
19
-
20
-
21
-
22
-
23
-
24
-
25
-
26
-
27
-
28
-
29
-
30
-
31
-
32
-
33
-
34
-
35
-
36
-
37
-
38
-
39
-
40
-
41
-
42
-
43
-
44
-
 45
45 -
 46
46 -
 47
47 -
 48
48 -
 49
49 -
 50
50 -
 51
51 -
 52
52 -
 53
53 -
 54
54 -
 55
55 -
 56
56 -
 57
57 -
 58
58 -
 59
59 -
 60
60 -
 61
61 -
 62
62 -
 63
63 -
 64
64 -
 65
65 -
66
-
67
-
68
-
69
-
70
-
71
-
72
-
73
-
74
-
75
-
76
-
77
-
78
-
79
-
80
-
81
-
82
-
83
-
84
-
85
-
86
-
87
-
88
-
89
-
90
-
91
-
92
-
93
-
94
-
95
-
96
-
97
-
98
-
99
-
100
-
101
-
102
-
103
-
104
-
105
-
106
-
107
-
108
-
109
-
110
-
111
-
112
 |
 |

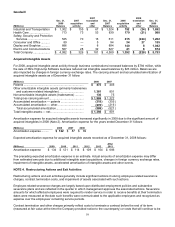
49
Advertising and merchandising: These costs are charged to operations in the year incurred, and totaled $468 million
in 2008, $469 million in 2007 and $471 million in 2006.
Research, development and related expenses: These costs are charged to operations in the year incurred and are
shown on a separate line of the Consolidated Statement of Income. Research, development and related expenses
totaled $1.404 billion in 2008, $1.368 billion in 2007 and $1.522 billion in 2006. In 2006, this included a $95 million in-
process research and development charge (discussed in Note 2) and $75 million in restructuring actions (Note 4).
Research and development expenses, covering basic scientific research and the application of scientific advances in
the development of new and improved products and their uses, totaled $851 million in 2008, $788 million in 2007,
and $943 million in 2006. Related expenses primarily include technical support provided by 3M to customers who are
using existing 3M products, and internally developed patent costs, which include costs and fees incurred to prepare,
file, secure and maintain patents.
Internal-use software: The Company capitalizes direct costs of materials and services used in the development of
internal-use software. Amounts capitalized are amortized on a straight-line basis over a period of three to five years
and are reported as a component of machinery and equipment within property, plant and equipment.
Environmental: Environmental expenditures relating to existing conditions caused by past operations that do not
contribute to current or future revenues are expensed. Reserves for liabilities for anticipated remediation costs are
recorded on an undiscounted basis when they are probable and reasonably estimable, generally no later than the
completion of feasibility studies or the Company’s commitment to a plan of action. Environmental expenditures for
capital projects that contribute to current or future operations generally are capitalized and depreciated over their
estimated useful lives.
Income taxes: The provision for income taxes is determined using the asset and liability approach. Under this
approach, deferred income taxes represent the expected future tax consequences of temporary differences between
the carrying amounts and tax basis of assets and liabilities. The Company records a valuation allowance to reduce its
deferred tax assets when uncertainty regarding their reliability exists. As of December 31, 2008, no significant
valuation allowances were recorded. As of January 1, 2007, the Company adopted FASB Interpretation No. 48 (FIN
48), “Accounting for Uncertainty in Income Taxes, an interpretation of FASB Statement No. 109”. 3M follows FIN 48
guidance to record uncertainties and judgments in the application of complex tax regulations in a multitude of
jurisdictions (refer to Note 8 for additional information).
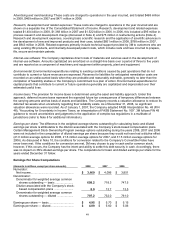
Earnings per share: The difference in the weighted average shares outstanding for calculating basic and diluted
earnings per share is attributable to the dilution associated with the Company’s stock-based compensation plans.
Certain Management Stock Ownership Program average options outstanding during the years 2008, 2007 and 2006
were not included in the computation of diluted earnings per share because they would not have had a dilutive effect
(41.0 million average options for 2008, 21.6 million average options for 2007, and 31.5 million average options for
2006). As discussed in Note 10, the conditions for conversion related to the Company’s Convertible Notes have
never been met. If the conditions for conversion are met, 3M may choose to pay in cash and/or common stock;
however, if this occurs, the Company has the intent and ability to settle this debt security in cash. Accordingly, there
was no impact on 3M’s diluted earnings per share. The computations for basic and diluted earnings per share for the
years ended December 31 follow:
Earnings Per Share Computations
(Amounts in millions, except per share amounts) 2008 2007 2006
Numerator:
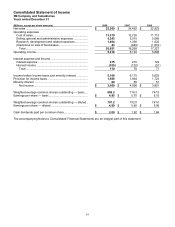
Net income...................................................... $ 3,460 $ 4,096 $ 3,851
Denominator:
Denominator for weighted average common
shares outstanding — basic ....................... 699.2
718.3 747.5
Dilution associated with the Company’s stock-
based compensation plans ........................ 8.0
13.7 13.5
Denominator for weighted average common
shares outstanding — diluted .................... 707.2
732.0 761.0
Earnings per share — basic............................... $4.95
$5.70 $5.15
Earnings per share — diluted............................. $4.89
$5.60 $5.06