3M 2008 Annual Report Download - page 101
Download and view the complete annual report
Please find page 101 of the 2008 3M annual report below. You can navigate through the pages in the report by either clicking on the pages listed below, or by using the keyword search tool below to find specific information within the annual report.-
 1
1 -
2
-
3
-
4
-
5
-
6
-
7
-
8
-
9
-
10
-
11
-
12
-
13
-
14
-
15
-
16
-
17
-
18
-
19
-
20
-
21
-
22
-
23
-
24
-
25
-
26
-
27
-
28
-
29
-
30
-
31
-
32
-
33
-
34
-
35
-
36
-
37
-
38
-
39
-
40
-
41
-
42
-
43
-
44
-
45
-
46
-
47
-
48
-
49
-
50
-
51
-
52
-
53
-
54
-
55
-
56
-
57
-
58
-
59
-
60
-
61
-
62
-
63
-
64
-
65
-
66
-
67
-
68
-
69
-
70
-
71
-
72
-
73
-
74
-
75
-
76
-
77
-
78
-
79
-
80
-
81
-
82
-
83
-
84
-
85
-
86
-
87
-
88
-
89
-
90
-
 91
91 -
 92
92 -
 93
93 -
 94
94 -
 95
95 -
 96
96 -
 97
97 -
 98
98 -
 99
99 -
 100
100 -
 101
101 -
 102
102 -
 103
103 -
 104
104 -
 105
105 -
 106
106 -
 107
107 -
 108
108 -
 109
109 -
 110
110 -
 111
111 -
112
 |
 |

95
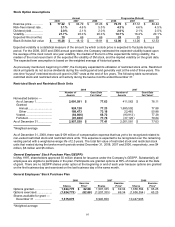
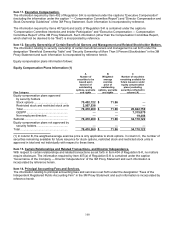
Stock Option Assumptions
Annual Progressive (Reload)
2008 2007 2006 2008 2007 2006
Exercise price.............. $ 77.22
$ 84.79 $ 87.23 $ 79.76 $ 87.12 $ 80.44
Risk-free interest rate.. 3.1 % 4.6 % 5.0 % 4.3 % 4.6 % 4.5 %
Dividend yield .............. 2.0 % 2.1 % 2.0 % 2.0 % 2.1 % 2.0 %
Volatility ....................... 21.7 % 20.0 % 20.0 % 18.7 % 18.4 % 20.1 %
Expected life (months) 70
69 69 25 25 39
Black-Scholes fair value $ 15.28
$ 18.12 $ 19.81 $ 12.00 $ 13.26 $ 12.53
Expected volatility is a statistical measure of the amount by which a stock price is expected to fluctuate during a
period. For the 2008, 2007 and 2006 annual grant date, the Company estimated the expected volatility based upon
the average of the most recent one year volatility, the median of the term of the expected life rolling volatility, the
median of the most recent term of the expected life volatility of 3M stock, and the implied volatility on the grant date.
The expected term assumption is based on the weighted average of historical grants.
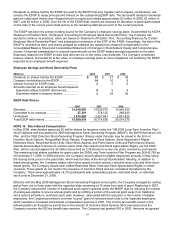
As previously mentioned, beginning in 2007, the Company expanded its utilization of restricted stock units. Restricted
stock unit grants do not accrue dividends during the vesting period and generally vest at the end of three years. The
one-time “buyout” restricted stock unit grant in 2007 vests at the end of five years. The following table summarizes
restricted stock and restricted stock unit activity during the twelve months ended December 31:
Restricted Stock and Restricted Stock Units
2008 2007
Number of
Awards
Grant Date
Fair Value*
Number of
Awards
Grant Date
Fair Value*
Nonvested balance —
As of January 1.................... 2,001,581 $ 77.63 411,562 $ 78.11
Granted
Annual .............................. 924,120 77.23 1,695,592 77.88
Other ................................ 188,473 73.16 22,465 50.88
Vested.................................. (64,806 ) 68.72 (90,913 ) 77.38
Forfeited............................... (91,830 ) 77.76 (37,125 ) 79.04
As of December 31.................. 2,957,538 $ 77.41 2,001,581 $ 77.63
*Weighted average
As of December 31, 2008, there was $109 million of compensation expense that has yet to be recognized related to
non-vested restricted stock and restricted stock units. This expense is expected to be recognized over the remaining
vesting period with a weighted-average life of 2.5 years. The total fair value of restricted stock and restricted stock
units that vested during the twelve-month periods ended December 31, 2008, 2007 and 2006, respectively, was $4
million, $6 million and $5 million.
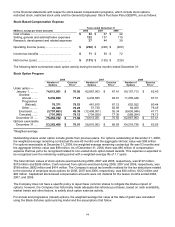
General Employees’ Stock Purchase Plan (GESPP):
In May 1997, shareholders approved 30 million shares for issuance under the Company’s GESPP. Substantially all
employees are eligible to participate in the plan. Participants are granted options at 85% of market value at the date
of grant. There are no GESPP shares under option at the beginning or end of each year because options are granted
on the first business day and exercised on the last business day of the same month.
General Employees’ Stock Purchase Plan
2008 2007 2006
Exercise Exercise Exercise
Shares Price* Shares Price* Shares Price*
Options granted....................... 1,624,775 $ 62.68 1,507,335 $ 69.34 1,656,554 $ 65.25
Options exercised.................... (1,624,775 ) (62.68 ) (1,507,335 ) 69.34 (1,656,554 ) 65.25
Shares available for grant —
December 31 ...................... 7,315,875
8,940,650 10,447,985
*Weighted average