3M 2008 Annual Report Download - page 41
Download and view the complete annual report
Please find page 41 of the 2008 3M annual report below. You can navigate through the pages in the report by either clicking on the pages listed below, or by using the keyword search tool below to find specific information within the annual report.-
 1
1 -
2
-
3
-
4
-
5
-
6
-
7
-
8
-
9
-
10
-
11
-
12
-
13
-
14
-
15
-
16
-
17
-
18
-
19
-
20
-
21
-
22
-
23
-
24
-
25
-
26
-
27
-
28
-
29
-
30
-
 31
31 -
 32
32 -
 33
33 -
 34
34 -
 35
35 -
 36
36 -
 37
37 -
 38
38 -
 39
39 -
 40
40 -
 41
41 -
 42
42 -
 43
43 -
 44
44 -
 45
45 -
 46
46 -
 47
47 -
 48
48 -
 49
49 -
 50
50 -
 51
51 -
52
-
53
-
54
-
55
-
56
-
57
-
58
-
59
-
60
-
61
-
62
-
63
-
64
-
65
-
66
-
67
-
68
-
69
-
70
-
71
-
72
-
73
-
74
-
75
-
76
-
77
-
78
-
79
-
80
-
81
-
82
-
83
-
84
-
85
-
86
-
87
-
88
-
89
-
90
-
91
-
92
-
93
-
94
-
95
-
96
-
97
-
98
-
99
-
100
-
101
-
102
-
103
-
104
-
105
-
106
-
107
-
108
-
109
-
110
-
111
-
112
 |
 |

35
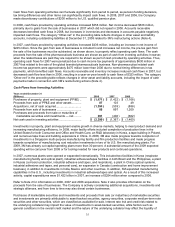
Cash flows from operating activities can fluctuate significantly from period to period, as pension funding decisions,
tax timing differences and other items can significantly impact cash flows. In 2008, 2007 and 2006, the Company
made discretionary contributions of $200 million to its U.S. qualified pension plan.
In 2008, cash flows provided by operating activities increased $258 million. Net income decreased $636 million,
primarily due to gains from the sale of businesses in 2007 which did not repeat in 2008. Accounts receivable
decreases benefited cash flows in 2008, but increases in inventories and decreases in accounts payable negatively
impacted cash flows. The category “Other-net” in the preceding table reflects changes in other asset and liability
accounts, including outstanding liabilities at December 31, 2008 related to 3M’s restructuring actions (Note 4).
In 2007, cash flows provided by operating activities increased $436 million, including an increase in net income of
$245 million. Since the gain from sale of businesses is included in and increases net income, the pre-tax gain from
the sale of the businesses must be subtracted, as shown above, to properly reflect operating cash flows. The cash
proceeds from the sale of the pharmaceuticals business are shown as part of cash from investing activities; however,
when the related taxes are paid they are required to be shown as part of cash provided by operating activities. Thus,
operating cash flows for 2007 were penalized due to cash income tax payments of approximately $630 million in
2007 that related to the sale of the global branded pharmaceuticals business. Non-pharmaceutical related cash
income tax payments were approximately $475 million lower than 2006 due to normal timing differences in tax
payments, which benefited cash flows. Accounts receivable and inventory increases reduced cash flows in 2007, but
decreased cash flow less than in 2006, resulting in a year-on-year benefit to cash flows of $323 million. The category
“Other-net” in the preceding table reflects changes in other asset and liability accounts, including the impact of cash
payments made in connection with 3M’s restructuring actions (Note 4).
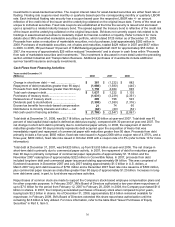
Cash Flows from Investing Activities:
Years ended December 31
(Millions) 2008 2007 2006
Purchases of property, plant and equipment (PP&E) .. $ (1,471 ) $ (1,422 ) $ (1,168 )
Proceeds from sale of PP&E and other assets............ 87 103 49
Acquisitions, net of cash acquired................................ (1,394 ) (539 ) (888 )
Proceeds from sale of businesses ............................... 88 897 1,209
Purchases and proceeds from sale or maturities of
marketable securities and investments — net.......... 291 (406 ) (662 )
Net cash used in investing activities ............................ $ (2,399 ) $ (1,367 ) $ (1,460 )
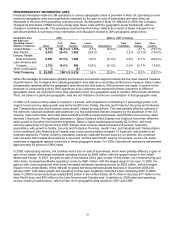
Investments in property, plant and equipment enable growth in diverse markets, helping to meet product demand and
increasing manufacturing efficiency. In 2008, major facility efforts included completion of production lines in the
United States for both Consumer and Office and Health Care, an R&D laboratory in Korea, a tape building in Poland,
and numerous tape lines and building expansions in China. In 2008, 3M also made progress towards completion of
investments in a Singapore multi-purpose manufacturing facility and film production facilities and made progress
towards completion of manufacturing cost reduction investments in two of its U.S. film manufacturing plants. For
2009, 3M has already cut capital spending plans more than 30 percent. A substantial amount of the 2009 expected
spending will be carryover from 2008 or for tooling needed for new products and continued operations.
In 2007, numerous plants were opened or expanded internationally. This included two facilities in Korea (respirator
manufacturing facility and optical plant), industrial adhesives/tapes facilities in both Brazil and the Philippines, a plant
in Russia (corrosion protection, industrial adhesive and tapes, and respirators), a plant in China (optical systems,
industrial adhesives and tapes, and personal care), an expansion in Canada (construction and home improvement
business), in addition to investments in India, Mexico and other countries. In addition, 3M expanded manufacturing
capabilities in the U.S., including investments in industrial adhesives/tapes and optical. As a result of this increased
activity, capital expenditures were $1.422 billion in 2007, an increase of $254 million when compared to 2006.
Refer to Note 2 for information on 2008, 2007 and 2006 acquisitions. Note 2 also provides information on the
proceeds from the sale of businesses. The Company is actively considering additional acquisitions, investments and
strategic alliances, and from time to time may also divest certain businesses.
Purchases of marketable securities and investments and proceeds from sale (or maturities) of marketable securities
and investments are primarily attributable to asset-backed securities, agency securities, corporate medium-term note
securities and other securities, which are classified as available-for-sale. Interest rate risk and credit risk related to
the underlying collateral may impact the value of investments in asset-backed securities, while factors such as
general conditions in the overall credit market and the nature of the underlying collateral may affect the liquidity of