3M 2008 Annual Report Download - page 30
Download and view the complete annual report
Please find page 30 of the 2008 3M annual report below. You can navigate through the pages in the report by either clicking on the pages listed below, or by using the keyword search tool below to find specific information within the annual report.-
 1
1 -
2
-
3
-
4
-
5
-
6
-
7
-
8
-
9
-
10
-
11
-
12
-
13
-
14
-
15
-
16
-
17
-
18
-
19
-
 20
20 -
 21
21 -
 22
22 -
 23
23 -
 24
24 -
 25
25 -
 26
26 -
 27
27 -
 28
28 -
 29
29 -
 30
30 -
 31
31 -
 32
32 -
 33
33 -
 34
34 -
 35
35 -
 36
36 -
 37
37 -
 38
38 -
 39
39 -
 40
40 -
41
-
42
-
43
-
44
-
45
-
46
-
47
-
48
-
49
-
50
-
51
-
52
-
53
-
54
-
55
-
56
-
57
-
58
-
59
-
60
-
61
-
62
-
63
-
64
-
65
-
66
-
67
-
68
-
69
-
70
-
71
-
72
-
73
-
74
-
75
-
76
-
77
-
78
-
79
-
80
-
81
-
82
-
83
-
84
-
85
-
86
-
87
-
88
-
89
-
90
-
91
-
92
-
93
-
94
-
95
-
96
-
97
-
98
-
99
-
100
-
101
-
102
-
103
-
104
-
105
-
106
-
107
-
108
-
109
-
110
-
111
-
112
 |
 |

24
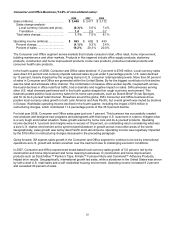
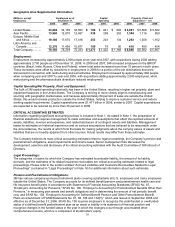
excess of 27 percent. Operating income in 2008 included $60 million in restructuring actions and exit activity
charges, primarily comprised of severance and related benefits, but also including $14 million in asset impairments.
2007 included $5 million in restructuring expenses, primarily severance and related benefits.
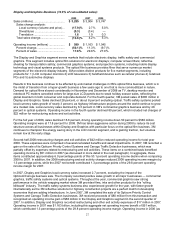
In 2007, sales growth was broad-based across all platforms, led by infection prevention solutions and skin and
wound care therapy products in medical, HFA-based components (non-CFC) for drug inhalers in drug delivery, and
healthcare funding and performance management solutions for the hospital market in health information systems.
Geographically, Health Care (without pharmaceuticals) achieved strong growth rates in all major regions, led by
Europe, the United States, and the combined Latin America and Canada area. Local-currency sales increased 18.3
percent, with acquisitions contributing 4.4 percentage points of this growth. Much of the acquisition growth came from
two deals that closed in late 2006 — Biotrace International, PLC, a U.K.-based provider of microbiology products,
and SoftMed, a Maryland-based provider of health information software solutions. Health Care also closed five
complementary acquisitions in 2007 to strengthen the portfolio and accelerate growth into the future in the medical,
oral care and health information systems businesses. Sales growth also included 4.5 percentage points of growth
due to supply agreements related to the sale of the global branded pharmaceuticals business. Operating income
increased 34.6 percent, with an operating income margin of 27.4 percent. Operating income for 2007 included $5
million in restructuring expenses, primarily severance and related benefits. Operating income for 2006 included $95
million of expensed in-process research and development costs related to the Brontes acquisition and also included
business-specific restructuring actions that totaled $15 million, primarily comprised of severance and related benefits
plus asset impairments.
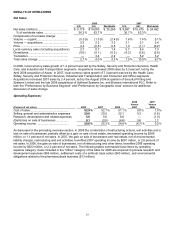
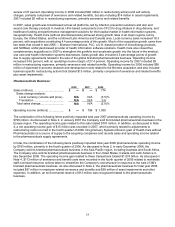
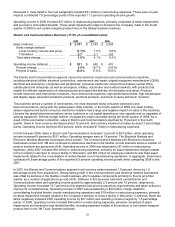
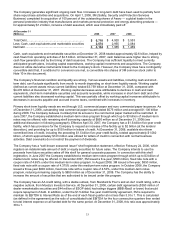
Pharmaceuticals Business:
2008 2007 2006
Sales (millions)....................................... $— $—
$ 774
Sales change analysis:
Local currency (volume and price).. N/A N/A (3.5 )%
Translation ...................................... N/A N/A 0.6
Total sales change.............................. N/A N/A (2.9)%
Operating income (millions) ................... $—
$ 796 $ 1,039
The combination of the following items positively impacted total year 2007 pharmaceuticals operating income by
$796 million. As discussed in Note 2, in January 2007 the Company sold its branded pharmaceuticals business in the
Europe region. The operating income gain related to this sale totaled $781 million. In addition, as discussed in Note
4, a net operating income gain of $15 million was recorded in 2007, which primarily related to adjustments to
restructuring costs incurred in the fourth quarter of 2006. Drug Delivery Systems Division (part of Health Care without
Pharmaceuticals) is a source of supply to the acquiring companies and records sales and operating income related
to the pharmaceuticals supply agreements.
In total, the combination of the following items positively impacted total year 2006 pharmaceuticals operating income
by $783 million, primarily in the fourth quarter of 2006. As discussed in Note 2, in early December 2006, the
Company sold its branded pharmaceuticals business in the Asia Pacific region, including Australia and South Africa.
The Company also sold its branded pharmaceuticals business in the United States, Canada and Latin America in
late December 2006. The operating income gain related to these transactions totaled $1.074 billion. As discussed in
Note 4, $112 million of severance and benefit costs were recorded in the fourth quarter of 2006 related to worldwide
staff overhead reduction actions taken to streamline the Company’s cost structure in response to the sale of 3M’s
branded pharmaceuticals business. As also discussed in Note 4, the pharmaceuticals business for total year 2006
included $97 million in employee-related severance and benefits and $69 million of asset impairments and other
expenses. In addition, an environmental reserve of $13 million was recognized related to the pharmaceuticals
business.