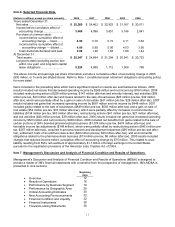
3M 2008 Annual Report Download - page 19
Download and view the complete annual report
Please find page 19 of the 2008 3M annual report below. You can navigate through the pages in the report by either clicking on the pages listed below, or by using the keyword search tool below to find specific information within the annual report.-
 1
1 -
2
-
3
-
4
-
5
-
6
-
7
-
8
-
 9
9 -
 10
10 -
 11
11 -
 12
12 -
 13
13 -
 14
14 -
 15
15 -
 16
16 -
 17
17 -
 18
18 -
 19
19 -
 20
20 -
 21
21 -
 22
22 -
 23
23 -
 24
24 -
 25
25 -
 26
26 -
 27
27 -
 28
28 -
 29
29 -
30
-
31
-
32
-
33
-
34
-
35
-
36
-
37
-
38
-
39
-
40
-
41
-
42
-
43
-
44
-
45
-
46
-
47
-
48
-
49
-
50
-
51
-
52
-
53
-
54
-
55
-
56
-
57
-
58
-
59
-
60
-
61
-
62
-
63
-
64
-
65
-
66
-
67
-
68
-
69
-
70
-
71
-
72
-
73
-
74
-
75
-
76
-
77
-
78
-
79
-
80
-
81
-
82
-
83
-
84
-
85
-
86
-
87
-
88
-
89
-
90
-
91
-
92
-
93
-
94
-
95
-
96
-
97
-
98
-
99
-
100
-
101
-
102
-
103
-
104
-
105
-
106
-
107
-
108
-
109
-
110
-
111
-
112
 |
 |

13
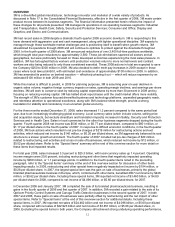
helped by a 6.7 percent increase in net sales, which included the divestiture impacts discussed above that reduced
sales growth by 3.8 percent.
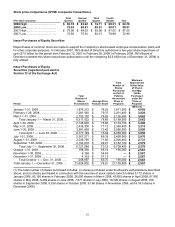
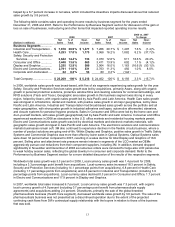
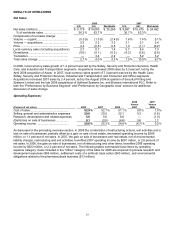
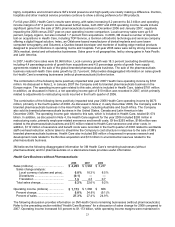
The following table contains sales and operating income results by business segment for the years ended
December 31, 2008 and 2007. Refer to the Performance by Business Segment section for discussion of the gain or
loss on sale of businesses, restructuring and other items that impacted reported operating income results.
2008 vs. 2007
2008 2007 % change
Net % of Oper. Net % of Oper. Net Oper.
(Dollars in millions) Sales Total Income Sales Total Income Sales Income
Business Segments ..............
Industrial and Transportation .. $ 7,818 30.9 % $ 1,477 $ 7,266 29.7 % $ 1,497 7.6 % (1.4 )%
Health Care ............................. 4,293 17.0 % 1,173 3,968 16.2 % 1,882 8.2 % (37.7 )%
Safety, Security and Protection
Services ............................... 3,642
14.4 % 736 3,070 12.6 % 611 18.6 % 20.4 %
Consumer and Office .............. 3,448 13.6 % 663 3,411 13.9 % 692 1.1 % (4.1 )%
Display and Graphics .............. 3,255 12.9 % 580 3,904 16.0 % 1,163 (16.6 )% (50.1 )%
Electro and Communications .. 2,791 11.0 % 531 2,763 11.3 % 492 1.0 % 8.0 %
Corporate and Unallocated ..... 22
0.2 % 58 80 0.3 % (144 )
Total Company ........................ $ 25,269 100 % $ 5,218 $ 24,462 100 % $ 6,193 3.3 % (15.7 )%
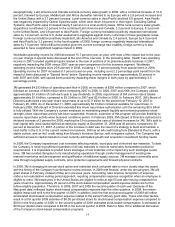
In 2008, worldwide sales growth was broad-based, with five of six segments experiencing sales growth for the year.
Safety, Security and Protection Services sales growth was led by acquisitions, primarily Aearo, along with organic
growth in personal protection solutions, protective window films and cleaning solutions for commercial buildings, and
RFID solutions (Track and Trace). Geographic area sales growth in this business segment was strong in every
region, helped by Aearo, with organic sales growth led by Asia Pacific and Latin America. Health Care sales growth
was strongest in orthodontics, dental and medical, with positive sales growth in all major geographies, led by Asia
Pacific and Latin America. Industrial and Transportation had broad-based sales growth across the portfolio and all
major geographies, with strong sales growth in industrial adhesives and tapes, automotive aftermarket, abrasives,
and closure systems for personal hygiene products. Sales in Consumer and Office were led by the home care and
do-it-yourself markets, with sales growth geographically led by Asia Pacific and Latin America. Consumer and Office
experienced weakness in 2008 as slowdowns in the U.S. office markets and residential housing markets persist.
Electro and Communications sales growth was led by electrical markets and electronic markets materials, with
geographic sales growth strongest in Asia Pacific and Latin America. The electronics solutions and communications
markets businesses remain soft. 3M also continued to experience declines in the flexible circuits business, where a
number of product solutions are going end-of-life. Within Display and Graphics, positive sales growth in Traffic Safety
Systems and Commercial Graphics was more than offset by lower sales in Optical Systems. Optical Systems sales
were down 34 percent when compared to 2007, resulting in a sales decline for total Display and Graphics of 16.6
percent. Selling price and attachment rate pressure remain intense in segments of the LCD market as OEMs
aggressively pursue cost reductions from their component suppliers, including 3M. In addition, demand dropped
significantly in November and December of 2008 as numerous orders were canceled for large-size LCD panels due
to weak holiday season sales, reflecting the global downturn in consumer and corporate demand. Refer to the
Performance by Business Segment section for a more detailed discussion of the results of the respective segments.
Worldwide total sales growth was 3.3 percent in 2008. Local-currency sales growth was 1.4 percent for 2008,
including a 3.3 percentage point benefit from acquisitions. Local-currency sales increased 18.3 percent in Safety,
Security and Protection Services (including 14.1 percentage points from acquisitions), 6.8 percent in Health Care
(including 1.7 percentage points from acquisitions) and 4.6 percent in Industrial and Transportation (including 3.9
percentage points from acquisitions). Local-currency sales declined 0.3 percent in Consumer and Office, 1.7 percent
in Electro and Communications and 17.9 percent in Display and Graphics.
In 2007, worldwide total sales increased 6.7 percent. Local-currency sales growth was 7.3 percent, with organic
local-currency growth of 4.9 percent (including 0.7 percentage point benefit from pharmaceuticals supply
agreements) and acquisitions adding 2.4 percent. Divestitures, primarily the sale of the global branded
pharmaceuticals business (Health Care segment), decreased worldwide sales growth by 3.8 percent. The sale of the
pharmaceuticals business was not presented as a discontinued operation due to the extent of the projected
continuing cash flows from 3M’s contractual supply relationship with the buyers in relation to those of the business
that was sold.