3M 2008 Annual Report Download - page 25
Download and view the complete annual report
Please find page 25 of the 2008 3M annual report below. You can navigate through the pages in the report by either clicking on the pages listed below, or by using the keyword search tool below to find specific information within the annual report.-
 1
1 -
2
-
3
-
4
-
5
-
6
-
7
-
8
-
9
-
10
-
11
-
12
-
13
-
14
-
 15
15 -
 16
16 -
 17
17 -
 18
18 -
 19
19 -
 20
20 -
 21
21 -
 22
22 -
 23
23 -
 24
24 -
 25
25 -
 26
26 -
 27
27 -
 28
28 -
 29
29 -
 30
30 -
 31
31 -
 32
32 -
 33
33 -
 34
34 -
 35
35 -
36
-
37
-
38
-
39
-
40
-
41
-
42
-
43
-
44
-
45
-
46
-
47
-
48
-
49
-
50
-
51
-
52
-
53
-
54
-
55
-
56
-
57
-
58
-
59
-
60
-
61
-
62
-
63
-
64
-
65
-
66
-
67
-
68
-
69
-
70
-
71
-
72
-
73
-
74
-
75
-
76
-
77
-
78
-
79
-
80
-
81
-
82
-
83
-
84
-
85
-
86
-
87
-
88
-
89
-
90
-
91
-
92
-
93
-
94
-
95
-
96
-
97
-
98
-
99
-
100
-
101
-
102
-
103
-
104
-
105
-
106
-
107
-
108
-
109
-
110
-
111
-
112
 |
 |

19
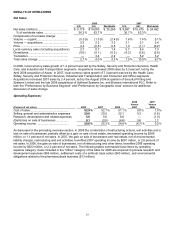
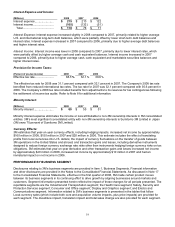
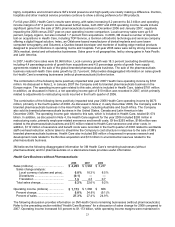
Interest Expense and Income:
(Millions) 2008 2007 2006
Interest expense........................ $ 215 $ 210 $ 122
Interest income.......................... (105 ) (132 ) (51 )
Total....................................... $ 110 $78 $71
Interest Expense: Interest expense increased slightly in 2008 compared to 2007, primarily related to higher average
U.S. and international long-term debt balances, which were partially offset by lower short-term debt balances and
interest rates. Interest expense increased in 2007 compared to 2006, primarily due to higher average debt balances
and higher interest rates.
Interest Income: Interest income was lower in 2008 compared to 2007, primarily due to lower interest rates, which
were partially offset by higher average cash and cash equivalent balances. Interest income increased in 2007
compared to 2006, primarily due to higher average cash, cash equivalent and marketable securities balances and
higher interest rates.
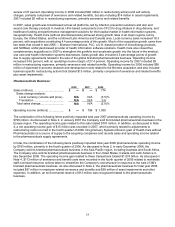
Provision for Income Taxes:
(Percent of pre-tax income) 2008 2007 2006
Effective tax rate........................ 31.1 % 32.1 % 30.6 %
The effective tax rate for 2008 was 31.1 percent compared with 32.1 percent in 2007. The Company’s 2008 tax rate
benefited from reduced international tax rates. The tax rate for 2007 was 32.1 percent compared with 30.6 percent in
2006. The Company’s 2006 tax rate included benefits from adjustments to its reserves for tax contingencies following
the settlement of income tax audits. Refer to Note 8 for additional information.
Minority Interest:
(Millions) 2008 2007 2006
Minority interest ......................... $ 60 $55 $51
Minority interest expense eliminates the income or loss attributable to non-3M ownership interests in 3M consolidated
entities. 3M’s most significant consolidated entity with non-3M ownership interests is Sumitomo 3M Limited in Japan
(3M owns 75 percent of Sumitomo 3M Limited).
Currency Effects:
3M estimates that year-on-year currency effects, including hedging impacts, increased net income by approximately
$160 million in 2008, $150 million in 2007 and $20 million in 2006. This estimate includes the effect of translating
profits from local currencies into U.S. dollars; the impact of currency fluctuations on the transfer of goods between
3M operations in the United States and abroad; and transaction gains and losses, including derivative instruments
designed to reduce foreign currency exchange rate risks other than instruments hedging foreign currency risks on tax
obligations. 3M estimates that year-on-year derivative and other transaction gains and losses increased net income
by approximately $40 million in 2008, increased net income by approximately $10 million in 2007 and had an
immaterial impact on net income in 2006.
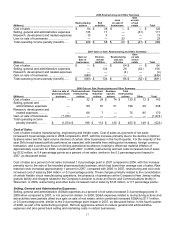
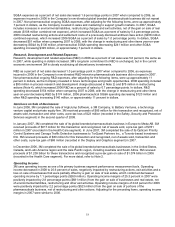
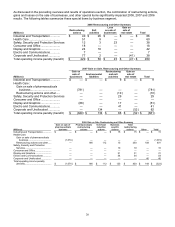
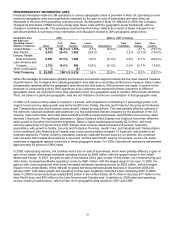
PERFORMANCE BY BUSINESS SEGMENT
Disclosures relating to 3M’s business segments are provided in Item 1, Business Segments. Financial information
and other disclosures are provided in the Notes to the Consolidated Financial Statements. As discussed in Note 17
to the Consolidated Financial Statements, effective in the first quarter of 2008, 3M made certain product moves
between its business segments in its continuing effort to drive growth by aligning businesses around markets and
customers. Segment information presented herein reflects the impact of these changes for all periods presented. The
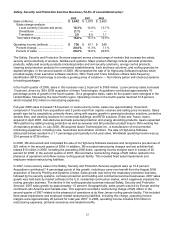
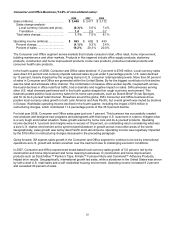
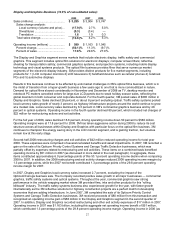
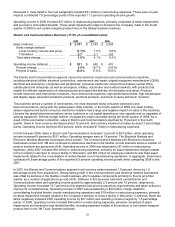
reportable segments are the Industrial and Transportation segment; the Health Care segment; Safety, Security and
Protection Services segment; Consumer and Office segment; Display and Graphics segment; and Electro and
Communications segment. Information related to 3M’s business segments is presented in the tables that follow.
Local-currency sales (which include both core and acquisition volume impacts, plus price impacts) are provided for
each segment. The divestiture impact, translation impact and total sales change are also provided for each segment.