3M 2008 Annual Report Download - page 33
Download and view the complete annual report
Please find page 33 of the 2008 3M annual report below. You can navigate through the pages in the report by either clicking on the pages listed below, or by using the keyword search tool below to find specific information within the annual report.-
 1
1 -
2
-
3
-
4
-
5
-
6
-
7
-
8
-
9
-
10
-
11
-
12
-
13
-
14
-
15
-
16
-
17
-
18
-
19
-
20
-
21
-
22
-
 23
23 -
 24
24 -
 25
25 -
 26
26 -
 27
27 -
 28
28 -
 29
29 -
 30
30 -
 31
31 -
 32
32 -
 33
33 -
 34
34 -
 35
35 -
 36
36 -
 37
37 -
 38
38 -
 39
39 -
 40
40 -
 41
41 -
 42
42 -
 43
43 -
44
-
45
-
46
-
47
-
48
-
49
-
50
-
51
-
52
-
53
-
54
-
55
-
56
-
57
-
58
-
59
-
60
-
61
-
62
-
63
-
64
-
65
-
66
-
67
-
68
-
69
-
70
-
71
-
72
-
73
-
74
-
75
-
76
-
77
-
78
-
79
-
80
-
81
-
82
-
83
-
84
-
85
-
86
-
87
-
88
-
89
-
90
-
91
-
92
-
93
-
94
-
95
-
96
-
97
-
98
-
99
-
100
-
101
-
102
-
103
-
104
-
105
-
106
-
107
-
108
-
109
-
110
-
111
-
112
 |
 |

27
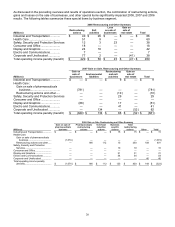
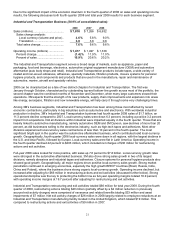
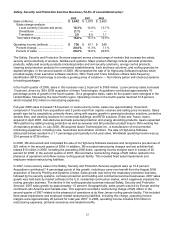
Display and Graphics Business (12.9% of consolidated sales):
2008 2007 2006
Sales (millions)........................................ $ 3,255 $ 3,904 $ 3,747
Sales change analysis:
Local currency (volume and price)... (17.9)% 2.7 % 5.0 %
Divestitures ...................................... (0.3 ) (0.4 ) —
Translation ....................................... 1.6 1.9 0.3
Total sales change............................... (16.6 )% 4.2 % 5.3 %
Operating income (millions) .................... $ 580 $ 1,163 $ 1,045
Percent change.................................... (50.1 )% 11.3 % (9.7 )%
Percent of sales ................................... 17.8 % 29.8 % 27.9 %
The Display and Graphics segment serves markets that include electronic display, traffic safety and commercial
graphics. This segment includes optical film solutions for electronic displays; computer screen filters; reflective
sheeting for transportation safety; commercial graphics systems; and projection systems, including mobile display
technology and visual systems products. The optical film business provides films that serve numerous market
segments of the electronic display industry. 3M provides distinct products for five market segments, including
products for: 1) LCD computer monitors 2) LCD televisions 3) handheld devices such as cellular phones 4) notebook
PCs and 5) automotive displays.
Results in this business continue to be affected by end-market challenges in 3M’s optical films business, which is in
the midst of transition from a hyper-growth business a few years ago to one that is more commoditized in nature.
Demand for optical films slowed considerably in November and December of 2008 as TV, desktop monitor and
notebook PC makers cancelled orders for large-size LCD panels due to weak holiday season sales, reflecting the
global downturn in both consumer and corporate demand. For the fourth quarter, 3M posted sales of $685 million in
Display and Graphics. Sales declined 28 percent, or about 8 percent excluding optical. Traffic safety systems posted
local-currency sales growth of nearly 3 percent, as highway infrastructure projects around the world continue to grow
at a modest rate. Local-currency sales declined by 6.3 percent in 3M’s commercial graphics business and by 48
percent in optical systems. Operating income in the fourth quarter declined 80 percent, which included net charges of
$22 million for restructuring actions and exit activities.
For the full year of 2008, sales declined 16.6 percent, driving operating income down 50 percent to $580 million.
Operating margins were at 17.8 percent for 2008. 3M has taken aggressive action during 2008 to reduce its cost
structure across all businesses within Display and Graphics with particular focus on the optical film business. 3M
continues to champion the energy saving story in the LCD monitor segment, and is gaining traction, but volumes
remain low at this early stage.
Second-half 2008 restructuring charges and exit activities of $42 million reduced operating income for total year
2008. These expenses were comprised of severance/related benefits and asset impairments. In 2007, 3M recorded a
gain on the sale of its Opticom Priority Control Systems and Canoga Traffic Detection businesses, which was
partially offset by expenses related to restructuring and exit activities. These items on a combined basis benefited
operating income by $51 million in 2007 (as discussed in more detail in the next paragraph). In aggregate, these
items contributed approximately 6.0 percentage points of this 50.1 percent operating income decline when comparing
2008 to 2007. In addition, the 2008 restructuring and exit activity charges reduced 2008 operating income margins by
1.3 percentage points, while the 2007 net benefit contributed 1.3 percentage points of the 29.8 percent operating
income margin for 2007.
In 2007, Display and Graphics local-currency sales increased 2.7 percent, excluding the impact of the
Opticom/Canoga business sale. The Company recorded positive sales growth in all major businesses — commercial
graphics, traffic safety systems and optical systems. Throughout the year, commercial graphics saw strong
performance in the vehicle wrapping market where 3M provides films, inks and other products for this “rolling
billboard” industry. The traffic safety systems business also experienced growth for the year, with faster growth
internationally as the 3M reflective solutions for highway construction projects are a perfect match in developing
economies that are adding infrastructure. In June 2007, 3M completed the sale of its Opticom Priority Control
Systems and Canoga Traffic Detection businesses. 3M received proceeds of $80 million from this transaction and
recognized an operating income gain of $68 million in the Display and Graphics segment in the second quarter of
2007. In addition, Display and Graphics recorded restructuring and other exit activity expenses of $17 million in 2007.
Operating income in 2007 was $1.163 billion, including this aggregate net operating income benefit of $51 million,
which contributed 1.3 percentage points of the 29.8 percent operating income margin. Operating income in 2006 (as