3M 2008 Annual Report Download - page 40
Download and view the complete annual report
Please find page 40 of the 2008 3M annual report below. You can navigate through the pages in the report by either clicking on the pages listed below, or by using the keyword search tool below to find specific information within the annual report.-
 1
1 -
2
-
3
-
4
-
5
-
6
-
7
-
8
-
9
-
10
-
11
-
12
-
13
-
14
-
15
-
16
-
17
-
18
-
19
-
20
-
21
-
22
-
23
-
24
-
25
-
26
-
27
-
28
-
29
-
 30
30 -
 31
31 -
 32
32 -
 33
33 -
 34
34 -
 35
35 -
 36
36 -
 37
37 -
 38
38 -
 39
39 -
 40
40 -
 41
41 -
 42
42 -
 43
43 -
 44
44 -
 45
45 -
 46
46 -
 47
47 -
 48
48 -
 49
49 -
 50
50 -
51
-
52
-
53
-
54
-
55
-
56
-
57
-
58
-
59
-
60
-
61
-
62
-
63
-
64
-
65
-
66
-
67
-
68
-
69
-
70
-
71
-
72
-
73
-
74
-
75
-
76
-
77
-
78
-
79
-
80
-
81
-
82
-
83
-
84
-
85
-
86
-
87
-
88
-
89
-
90
-
91
-
92
-
93
-
94
-
95
-
96
-
97
-
98
-
99
-
100
-
101
-
102
-
103
-
104
-
105
-
106
-
107
-
108
-
109
-
110
-
111
-
112
 |
 |

34
3M’s cash and cash equivalents balance at December 31, 2008 totaled $1.849 billion, with an additional $725 million
in current and long-term marketable securities. 3M’s strong balance sheet and liquidity provide the Company with
significant flexibility to take advantage of numerous opportunities going forward. The Company will continue to invest
in its operations to drive growth, including continual review of acquisition opportunities. 3M paid dividends of $1.398
billion in 2008, and has a long history of dividend increases. In February 2009, the Board of Directors increased the
quarterly dividend on 3M common stock by 2 percent to 51 cents per share, equivalent to an annual dividend of
$2.04 per share. In February 2007, 3M’s Board of Directors authorized a two-year share repurchase of up to $7.0
billion for the period from February 12, 2007 to February 28, 2009. At December 31, 2008, the Company has $2.6
billion remaining under this authorization. In February 2009, 3M’s Board of Directors extended this share repurchase
authorization until the remaining $2.6 billion is fully utilized.
In 2009, the Company expects to contribute an amount in the range of $600 million to $850 million to its U.S. and
international pension plans. The Company does not have a required minimum pension contribution obligation for its
U.S. plans in 2009. Therefore, the amount of the anticipated discretionary contribution could vary significantly
depending on the U.S. qualified plans’ funding status as of the 2009 measurement date and the anticipated tax
deductibility of the contribution. Future contributions will also depend on market conditions, interest rates and other
factors. 3M believes its strong cash flow and balance sheet will allow it to fund future pension needs without
compromising growth opportunities.
The Company uses various working capital measures that place emphasis and focus on certain working capital
assets and liabilities. These measures are not defined under U.S. generally accepted accounting principles and may
not be computed the same as similarly titled measures used by other companies. One of the primary working capital
measures 3M uses is a combined index, which includes accounts receivable, inventory and accounts payable. This
combined index (defined as quarterly net sales — fourth quarter at year-end — multiplied by four, divided by ending
net accounts receivable plus inventory less accounts payable) was 4.5 at December 31, 2008, down from 5.3 at
December 31, 2007. Receivables decreased $167 million, or 5.0 percent, compared with December 31, 2007.
Currency translation decreased accounts receivable by $97 million year-on-year, as the U.S. dollar strengthened in
aggregate against a multitude of currencies. Inventories increased $161 million, or 5.6 percent, compared with
December 31, 2007. Currency translation decreased inventories by $134 million year-on-year. Accounts payable
decreased $204 million compared with December 31, 2007. Currency translation decreased accounts payable by
$35 million year-on-year.
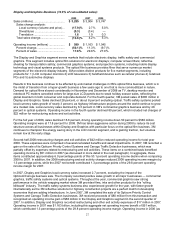
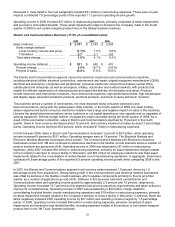
Cash flows from operating, investing and financing activities are provided in the tables that follow. Individual amounts
in the Consolidated Statement of Cash Flows exclude the effects of acquisitions, divestitures and exchange rate
impacts, which are presented separately in the cash flows. Thus, the amounts presented in the following operating,
investing and financing activities tables reflect changes in balances from period to period adjusted for these effects.
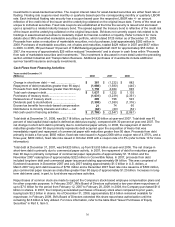
Cash Flows from Operating Activities:
Years ended December 31
(Millions) 2008 2007 2006
Net income ................................................................... $ 3,460 $ 4,096 $ 3,851
Depreciation and amortization ..................................... 1,153 1,072 1,079
Company pension contributions................................... (421 ) (376 ) (348 )
Company postretirement contributions ........................ (53 ) (3 ) (37 )
Company pension expense.......................................... 89 190 347
Company postretirement expense ............................... 16 65 93
Stock-based compensation expense ........................... 202 228 200
Loss/(Gain) from sale of businesses............................ 23 (849 ) (1,074 )
Income taxes (deferred and accrued income taxes).... (44 ) (34 ) (178 )
Excess tax benefits from stock-based compensation .. (21 ) (74 ) (60 )
Accounts receivable ..................................................... 197 (35 ) (103 )
Inventories.................................................................... (127 ) (54 ) (309 )
Accounts payable ......................................................... (224 ) (4 ) 68
Product and other insurance receivables and claims .. 153 158 58
Other — net.................................................................. 130 (105 ) 252
Net cash provided by operating activities..................... $ 4,533 $ 4,275 $ 3,839