eTrade 2001 Annual Report Download - page 16
Download and view the complete annual report
Please find page 16 of the 2001 eTrade annual report below. You can navigate through the pages in the report by either clicking on the pages listed below, or by using the keyword search tool below to find specific information within the annual report.-
 1
1 -
 2
2 -
 3
3 -
 4
4 -
 5
5 -
 6
6 -
 7
7 -
 8
8 -
 9
9 -
 10
10 -
 11
11 -
 12
12 -
 13
13 -
 14
14 -
 15
15 -
 16
16 -
 17
17 -
 18
18 -
 19
19 -
 20
20 -
 21
21 -
 22
22 -
 23
23 -
 24
24 -
 25
25 -
 26
26 -
 27
27 -
 28
28 -
 29
29 -
 30
30 -
 31
31 -
 32
32 -
 33
33 -
 34
34 -
 35
35 -
 36
36 -
 37
37 -
 38
38 -
 39
39 -
 40
40 -
 41
41 -
 42
42 -
 43
43 -
 44
44 -
 45
45 -
 46
46 -
 47
47 -
 48
48 -
 49
49 -
 50
50 -
 51
51 -
 52
52 -
 53
53 -
 54
54 -
 55
55 -
 56
56 -
 57
57 -
 58
58 -
 59
59 -
 60
60 -
 61
61 -
 62
62 -
 63
63 -
 64
64 -
 65
65 -
 66
66 -
 67
67 -
 68
68 -
 69
69 -
 70
70 -
 71
71 -
 72
72 -
 73
73 -
 74
74 -
 75
75 -
 76
76 -
 77
77 -
 78
78 -
 79
79 -
 80
80 -
 81
81 -
 82
82 -
 83
83 -
 84
84 -
 85
85 -
 86
86 -
 87
87 -
 88
88 -
 89
89 -
 90
90 -
 91
91 -
 92
92 -
 93
93 -
 94
94 -
 95
95 -
 96
96 -
 97
97 -
 98
98 -
 99
99 -
 100
100 -
 101
101 -
 102
102 -
 103
103 -
 104
104 -
 105
105 -
 106
106 -
 107
107 -
 108
108 -
 109
109 -
 110
110 -
 111
111 -
 112
112 -
 113
113 -
 114
114 -
 115
115 -
 116
116 -
 117
117 -
 118
118 -
 119
119 -
 120
120 -
 121
121 -
 122
122 -
 123
123 -
 124
124 -
 125
125 -
 126
126 -
 127
127 -
 128
128 -
 129
129 -
 130
130 -
 131
131 -
 132
132 -
 133
133 -
 134
134 -
 135
135 -
 136
136 -
 137
137 -
 138
138 -
 139
139 -
 140
140 -
 141
141 -
 142
142 -
 143
143 -
 144
144 -
 145
145 -
 146
146 -
 147
147 -
 148
148 -
 149
149 -
 150
150 -
 151
151 -
 152
152 -
 153
153 -
 154
154 -
 155
155 -
 156
156 -
 157
157 -
 158
158 -
 159
159 -
 160
160 -
 161
161 -
 162
162 -
 163
163 -
 164
164 -
 165
165 -
 166
166 -
 167
167 -
 168
168 -
 169
169 -
 170
170 -
 171
171 -
 172
172 -
 173
173 -
 174
174 -
 175
175 -
 176
176 -
 177
177 -
 178
178 -
 179
179 -
 180
180 -
 181
181 -
 182
182 -
 183
183 -
 184
184 -
 185
185 -
 186
186 -
 187
187 -
 188
188 -
 189
189 -
 190
190 -
 191
191 -
 192
192 -
 193
193 -
 194
194 -
 195
195 -
 196
196 -
 197
197
 |
 |

Table of Contents
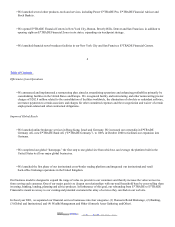
Maturity of Loan Portfolio. The following table shows, as of December 31, 2001, the dollar amount of loans maturing in our portfolio
in the time periods indicated. This information includes scheduled principal repayments, based on the loans’ contractual maturities.
We report demand loans, loans with no stated repayment schedule and no stated maturity, and overdrafts as due within one year. The
table below does not include any estimate of prepayments. Prepayments may significantly shorten the average life of a loan and may
cause our actual repayment experience to differ from that shown below.
DueinOne
YearorLess
Due in One toFiveYears Due After Five Years Total
(in thousands)
Real estate loans:
One- to four-family fixed-rate $ 8,465 $ 35,627 $ 3,628,420 $ 3,672,512
One- to four-family
adjustable-rate
486 3,075 2,642,391 2,645,952
Multi-family — — 183 183
Commercial — 9 1,972 1,981
Mixed-use 87 39 509 635
Consumer and other loans:
Home equity lines of credit and
second mortgage
loans
— 70 22,989 23,059
Automobiles and recreational
vehicles loans
13,253 1,243,345 378,452 1,635,050
Other 50 12,187 — 12,237
Total $ 22,341 $ 1,294,352 $ 6,674,916 $ 7,991,609
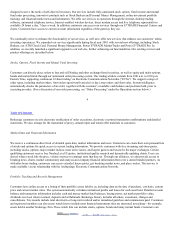
The following table shows, as of December 31, 2001, the dollar amount of our loans that mature after December 31, 2001. We have
allocated these loans between those with fixed interest rates and those with adjustable interest rates.
Fixed Rates Adjustable Rates Total
(in thousands)
Real estate loans:
One- to four-family $ 3,672,512 $ 2,645,952 $ 6,318,464
Multi-family — 183 183
Commercial 1,130 851 1,981
Mixed-use 237 398 635
Consumer and other loans:
Home equity lines of credit and second mortgage
loans
19,137 3,922 23,059
Automobiles and recreational vehicles loans 1,625,396 9,654 1,635,050
Other — 12,237 12,237
Total $ 5,318,412 $ 2,673,197 $ 7,991,609
2002. EDGAR Online, Inc.
