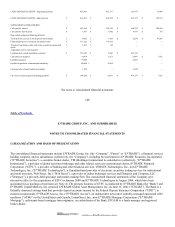
eTrade 2001 Annual Report Download - page 109
Download and view the complete annual report
Please find page 109 of the 2001 eTrade annual report below. You can navigate through the pages in the report by either clicking on the pages listed below, or by using the keyword search tool below to find specific information within the annual report.-
 1
1 -
 2
2 -
 3
3 -
 4
4 -
 5
5 -
 6
6 -
 7
7 -
 8
8 -
 9
9 -
 10
10 -
 11
11 -
 12
12 -
 13
13 -
 14
14 -
 15
15 -
 16
16 -
 17
17 -
 18
18 -
 19
19 -
 20
20 -
 21
21 -
 22
22 -
 23
23 -
 24
24 -
 25
25 -
 26
26 -
 27
27 -
 28
28 -
 29
29 -
 30
30 -
 31
31 -
 32
32 -
 33
33 -
 34
34 -
 35
35 -
 36
36 -
 37
37 -
 38
38 -
 39
39 -
 40
40 -
 41
41 -
 42
42 -
 43
43 -
 44
44 -
 45
45 -
 46
46 -
 47
47 -
 48
48 -
 49
49 -
 50
50 -
 51
51 -
 52
52 -
 53
53 -
 54
54 -
 55
55 -
 56
56 -
 57
57 -
 58
58 -
 59
59 -
 60
60 -
 61
61 -
 62
62 -
 63
63 -
 64
64 -
 65
65 -
 66
66 -
 67
67 -
 68
68 -
 69
69 -
 70
70 -
 71
71 -
 72
72 -
 73
73 -
 74
74 -
 75
75 -
 76
76 -
 77
77 -
 78
78 -
 79
79 -
 80
80 -
 81
81 -
 82
82 -
 83
83 -
 84
84 -
 85
85 -
 86
86 -
 87
87 -
 88
88 -
 89
89 -
 90
90 -
 91
91 -
 92
92 -
 93
93 -
 94
94 -
 95
95 -
 96
96 -
 97
97 -
 98
98 -
 99
99 -
 100
100 -
 101
101 -
 102
102 -
 103
103 -
 104
104 -
 105
105 -
 106
106 -
 107
107 -
 108
108 -
 109
109 -
 110
110 -
 111
111 -
 112
112 -
 113
113 -
 114
114 -
 115
115 -
 116
116 -
 117
117 -
 118
118 -
 119
119 -
 120
120 -
 121
121 -
 122
122 -
 123
123 -
 124
124 -
 125
125 -
 126
126 -
 127
127 -
 128
128 -
 129
129 -
 130
130 -
 131
131 -
 132
132 -
 133
133 -
 134
134 -
 135
135 -
 136
136 -
 137
137 -
 138
138 -
 139
139 -
 140
140 -
 141
141 -
 142
142 -
 143
143 -
 144
144 -
 145
145 -
 146
146 -
 147
147 -
 148
148 -
 149
149 -
 150
150 -
 151
151 -
 152
152 -
 153
153 -
 154
154 -
 155
155 -
 156
156 -
 157
157 -
 158
158 -
 159
159 -
 160
160 -
 161
161 -
 162
162 -
 163
163 -
 164
164 -
 165
165 -
 166
166 -
 167
167 -
 168
168 -
 169
169 -
 170
170 -
 171
171 -
 172
172 -
 173
173 -
 174
174 -
 175
175 -
 176
176 -
 177
177 -
 178
178 -
 179
179 -
 180
180 -
 181
181 -
 182
182 -
 183
183 -
 184
184 -
 185
185 -
 186
186 -
 187
187 -
 188
188 -
 189
189 -
 190
190 -
 191
191 -
 192
192 -
 193
193 -
 194
194 -
 195
195 -
 196
196 -
 197
197
 |
 |

Unearned Employee Stock Ownership Plan shares — (1,560 )
Shareowners’ notes receivable (32,707 ) (19,103 )
Deferred stock compensation (28,110 ) —
Accumulated deficit (247,087 ) (6,908 )
Accumulated other comprehensive income (loss) (197,377 ) 66,722
Total shareowners’ equity 1,570,914 1,856,833
Total liabilities and shareowners’ equity $ 18,172,414 $ 17,317,437
See notes to consolidated financial statements
94
Table of Contents
E*TRADE GROUP, INC. AND SUBSIDIARIES
CONSOLIDATED STATEMENTS OF OPERATIONS
(in thousands, except per share amounts)
Year Ended
December31, 2001
ThreeMonths Ended
December31, 2000 Year Ended
September30, 2000 Year Ended
September30, 1999
Revenues:
Transaction revenues $ 407,161 $ 153,405 $ 739,078 $ 355,830
Interest income 1,159,871 337,890 960,358 369,074
Global and institutional 152,822 37,454 166,061 124,233
Gains on sales of originated loans 95,478 — — —
Gains on bank loans held for sale and other securities—net 75,836 7,583 8,491 6,255
Other 170,947 32,700 99,195 34,291
Gross revenues 2,062,115 569,032 1,973,183 889,683
Interest expense (779,275 )
(233,619 )
(600,862 )
(215,452 )
Provision for loan losses (7,476 )
(1,647 )
(4,003 )
(2,783 )
Net revenues 1,275,364 333,766 1,368,318 671,448
Cost of services 595,590 133,260 515,571 302,342
Operating expenses:
Selling and marketing 253,422 97,940 521,532 325,449
Technology development 88,717 29,161 142,914 79,935
General and administrative 236,353 57,901 209,436 102,826
Amortization of goodwill and other intangibles 43,091 7,811 22,764 2,915
Acquisition-related expenses 11,174 784 36,427 7,174
Facility restructuring and other nonrecurring charges 202,765 — — —
Executive loan settlement 30,210 — — —
2002. EDGAR Online, Inc.
