eTrade 2001 Annual Report Download - page 108
Download and view the complete annual report
Please find page 108 of the 2001 eTrade annual report below. You can navigate through the pages in the report by either clicking on the pages listed below, or by using the keyword search tool below to find specific information within the annual report.-
 1
1 -
2
-
3
-
4
-
5
-
6
-
7
-
8
-
9
-
10
-
11
-
12
-
13
-
14
-
15
-
16
-
17
-
18
-
19
-
20
-
21
-
22
-
23
-
24
-
25
-
26
-
27
-
28
-
29
-
30
-
31
-
32
-
33
-
34
-
35
-
36
-
37
-
38
-
39
-
40
-
41
-
42
-
43
-
44
-
45
-
46
-
47
-
48
-
49
-
50
-
51
-
52
-
53
-
54
-
55
-
56
-
57
-
58
-
59
-
60
-
61
-
62
-
63
-
64
-
65
-
66
-
67
-
68
-
69
-
70
-
71
-
72
-
73
-
74
-
75
-
76
-
77
-
78
-
79
-
80
-
81
-
82
-
83
-
84
-
85
-
86
-
87
-
88
-
89
-
90
-
91
-
92
-
93
-
94
-
95
-
96
-
97
-
 98
98 -
 99
99 -
 100
100 -
 101
101 -
 102
102 -
 103
103 -
 104
104 -
 105
105 -
 106
106 -
 107
107 -
 108
108 -
 109
109 -
 110
110 -
 111
111 -
 112
112 -
 113
113 -
 114
114 -
 115
115 -
 116
116 -
 117
117 -
 118
118 -
119
-
120
-
121
-
122
-
123
-
124
-
125
-
126
-
127
-
128
-
129
-
130
-
131
-
132
-
133
-
134
-
135
-
136
-
137
-
138
-
139
-
140
-
141
-
142
-
143
-
144
-
145
-
146
-
147
-
148
-
149
-
150
-
151
-
152
-
153
-
154
-
155
-
156
-
157
-
158
-
159
-
160
-
161
-
162
-
163
-
164
-
165
-
166
-
167
-
168
-
169
-
170
-
171
-
172
-
173
-
174
-
175
-
176
-
177
-
178
-
179
-
180
-
181
-
182
-
183
-
184
-
185
-
186
-
187
-
188
-
189
-
190
-
191
-
192
-
193
-
194
-
195
-
196
-
197
 |
 |

Table of Contents
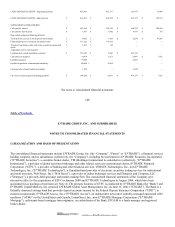
E*TRADE GROUP, INC. AND SUBSIDIARIES
CONSOLIDATED BALANCE SHEETS
(in thousands, except share amounts)
December 31,
2001
September 30,
2000
ASSETS
Cash and equivalents $ 836,201 $ 433,377
Cash and investments required to be segregated under federal or other regulations 764,729 125,862
Brokerage receivables—net 2,139,153 6,542,508
Mortgage-backed securities 3,556,619 4,188,553
Loans receivable—net of allowance for loan losses of $19,874 at December 31, 2001
and $10,930 at September 30, 2000
6,394,368 4,077,354
Loans held for sale 1,616,089 95,400
Investments 1,168,623 727,284
Property and equipment—net 331,724 334,262
Goodwill and other intangibles 684,426 484,166
Other assets 680,482 308,671
Total assets $ 18,172,414 $ 17,317,437
LIABILITIES AND SHAREOWNERS’ EQUITY
Liabilities:
Brokerage payables $ 2,699,984 $ 6,170,830
Banking deposits 8,082,859 4,721,801
Borrowings by bank subsidiary 4,170,440 3,531,000
Convertible subordinated notes 760,250 650,000
Accounts payable, accrued and other liabilities 818,464 356,326
Total liabilities 16,531,997 15,429,957
Company-obligated mandatorily redeemable preferred capital securities of subsidiary
trusts holding solely junior subordinated debentures of ETFC (redemption value
$72,375)
69,503 30,647
Commitments and contingencies
Shareowners’ equity:
Preferred stock, shares authorized: 1,000,000; issued and outstanding: none at
December 31, 2001 and September 30, 2000
Shares exchangeable into common stock, $.01 par value, shares authorized:
10,644,223; issued and outstanding: 1,825,632 at December 30, 2001 and 5,619,543
at September 30, 2000
18 56
Common stock, $.01 par value, shares authorized: 600,000,000; issued and
outstanding: 347,592,480 at December 31, 2001 and 304,504,764 at September 30,
2000
3,476 3,045
Additional paid-in capital 2,072,701 1,814,581
2002. EDGAR Online, Inc.