eTrade 2001 Annual Report Download - page 112
Download and view the complete annual report
Please find page 112 of the 2001 eTrade annual report below. You can navigate through the pages in the report by either clicking on the pages listed below, or by using the keyword search tool below to find specific information within the annual report.-
 1
1 -
2
-
3
-
4
-
5
-
6
-
7
-
8
-
9
-
10
-
11
-
12
-
13
-
14
-
15
-
16
-
17
-
18
-
19
-
20
-
21
-
22
-
23
-
24
-
25
-
26
-
27
-
28
-
29
-
30
-
31
-
32
-
33
-
34
-
35
-
36
-
37
-
38
-
39
-
40
-
41
-
42
-
43
-
44
-
45
-
46
-
47
-
48
-
49
-
50
-
51
-
52
-
53
-
54
-
55
-
56
-
57
-
58
-
59
-
60
-
61
-
62
-
63
-
64
-
65
-
66
-
67
-
68
-
69
-
70
-
71
-
72
-
73
-
74
-
75
-
76
-
77
-
78
-
79
-
80
-
81
-
82
-
83
-
84
-
85
-
86
-
87
-
88
-
89
-
90
-
91
-
92
-
93
-
94
-
95
-
96
-
97
-
98
-
99
-
100
-
101
-
 102
102 -
 103
103 -
 104
104 -
 105
105 -
 106
106 -
 107
107 -
 108
108 -
 109
109 -
 110
110 -
 111
111 -
 112
112 -
 113
113 -
 114
114 -
 115
115 -
 116
116 -
 117
117 -
 118
118 -
 119
119 -
 120
120 -
 121
121 -
 122
122 -
123
-
124
-
125
-
126
-
127
-
128
-
129
-
130
-
131
-
132
-
133
-
134
-
135
-
136
-
137
-
138
-
139
-
140
-
141
-
142
-
143
-
144
-
145
-
146
-
147
-
148
-
149
-
150
-
151
-
152
-
153
-
154
-
155
-
156
-
157
-
158
-
159
-
160
-
161
-
162
-
163
-
164
-
165
-
166
-
167
-
168
-
169
-
170
-
171
-
172
-
173
-
174
-
175
-
176
-
177
-
178
-
179
-
180
-
181
-
182
-
183
-
184
-
185
-
186
-
187
-
188
-
189
-
190
-
191
-
192
-
193
-
194
-
195
-
196
-
197
 |
 |

Conversion of Exchangeable
Shares of EGI Canada
Corporation to common stock
(3,734 ) (37 )
3,734 37 —
Balance, September 30, 2000 — $ — 5,620 $ 56 304,505 $ 3,045 $ 1,814,581 $ (1,560 )
$ (19,103 )
$ (6,908 )
$ 66,722 $ 1,856,833
96
Table of Contents
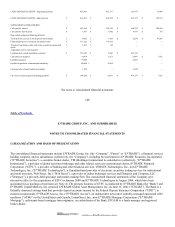
E*TRADE GROUP, INC. AND SUBSIDIARIES
CONSOLIDATED STATEMENTS OF SHAREOWNERS’ EQUITY—(Continued)
(in thousands)
Preferred Stock Shares Exchangeable
into CommonStock
Common Stock Additional
Paid-in
Capital
Unearned
ESOP
Shares
Shareowners’
Notes Receivable
Deferred
Compensation
Retained
Earnings
(Accumulated
Deficit)
Accumulated Other
Comprehensive
Income (Loss)
Total
Shareowners’
Equity
Shares Amoun
t
Shar
es
Amoun
t
Shares Amount
Income before cumulative
effect of accounting change
— $ — — $ — — $ — $ — $ — $ — $ — $ 1,436 $ — $ 1,436
Cumulative effect of
accounting
charge
(83 )
— (83 )
Net depreciation of
available-for-sale securities
(56,059 )
(56,059 )
Less realized gain (3,582 )
(3,582 )
Unrealized loss on
available-for-sale securities
(59,641 )
(59,641 )
Unrealized loss on cash
flow hedges
(122,037 )
(122,037 )
Tax benefit on other
comprehensive income
items
57,054 57,054
Total comprehensive loss (123,271 )
Exercise of stock options,
including tax benefit
1,114 11 5,473 (537 )
4,947
Exercise of warrants,
including tax benefit
525 5 5
Release of unearned ESOP
shares
138 138
Issuance of common stock
for purchase acquisitions
618 6 8,685 8,691
Conversion of
Exchangeable Shares of
EGI Canada Corporation
to common stock
(1,51
8
) (15 )
1,518 15 —
Other employee stock
transactions
(60 )
(1,295 )
(1,295 )
Balance, December 31,
2000
— $ — 4,102 $ 41 308,220 $ 3,082 $ 1,827,444 $ (1,422 )
$ (19,640 )
$ — $ (5,555 )
$ (57,902 )
$ 1,746,048
97
Table of Contents
E*TRADE GROUP, INC. AND SUBSIDIARIES
CONSOLIDATED STATEMENTS OF SHAREOWNERS’ EQUITY—(Continued)
2002. EDGAR Online, Inc.