Xcel Energy 2015 Annual Report Download - page 96
Download and view the complete annual report
Please find page 96 of the 2015 Xcel Energy annual report below. You can navigate through the pages in the report by either clicking on the pages listed below, or by using the keyword search tool below to find specific information within the annual report.-
 1
1 -
2
-
3
-
4
-
5
-
6
-
7
-
8
-
9
-
10
-
11
-
12
-
13
-
14
-
15
-
16
-
17
-
18
-
19
-
20
-
21
-
22
-
23
-
24
-
25
-
26
-
27
-
28
-
29
-
30
-
31
-
32
-
33
-
34
-
35
-
36
-
37
-
38
-
39
-
40
-
41
-
42
-
43
-
44
-
45
-
46
-
47
-
48
-
49
-
50
-
51
-
52
-
53
-
54
-
55
-
56
-
57
-
58
-
59
-
60
-
61
-
62
-
63
-
64
-
65
-
66
-
67
-
68
-
69
-
70
-
71
-
72
-
73
-
74
-
75
-
76
-
77
-
78
-
79
-
80
-
81
-
82
-
83
-
84
-
85
-
 86
86 -
 87
87 -
 88
88 -
 89
89 -
 90
90 -
 91
91 -
 92
92 -
 93
93 -
 94
94 -
 95
95 -
 96
96 -
 97
97 -
 98
98 -
 99
99 -
 100
100 -
 101
101 -
 102
102 -
 103
103 -
 104
104 -
 105
105 -
 106
106 -
107
-
108
-
109
-
110
-
111
-
112
-
113
-
114
-
115
-
116
-
117
-
118
-
119
-
120
-
121
-
122
-
123
-
124
-
125
-
126
-
127
-
128
-
129
-
130
-
131
-
132
-
133
-
134
-
135
-
136
-
137
-
138
-
139
-
140
-
141
-
142
-
143
-
144
-
145
-
146
-
147
-
148
-
149
-
150
-
151
-
152
-
153
-
154
-
155
-
156
-
157
-
158
-
159
-
160
-
161
-
162
-
163
-
164
-
165
-
166
-
167
-
168
-
169
-
170
-
171
-
172
-
173
-
174
-
175
-
176
-
177
-
178
-
179
-
180
 |
 |

78
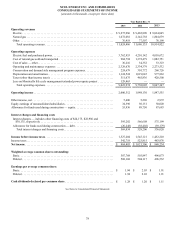
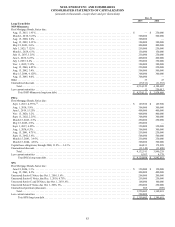
XCEL ENERGY INC. AND SUBSIDIARIES
CONSOLIDATED STATEMENTS OF INCOME
(amounts in thousands, except per share data)
Year Ended Dec. 31
2015 2014 2013
Operating revenues
Electric . . . . . . . . . . . . . . . . . . . . . . . . . . . . . . . . . . . . . . . . . . . . . . . . . . . . . . . . . . . . . . . . $ 9,275,986 $ 9,465,890 $ 9,034,045
Natural gas . . . . . . . . . . . . . . . . . . . . . . . . . . . . . . . . . . . . . . . . . . . . . . . . . . . . . . . . . . . . . 1,672,081 2,142,738 1,804,679
Other. . . . . . . . . . . . . . . . . . . . . . . . . . . . . . . . . . . . . . . . . . . . . . . . . . . . . . . . . . . . . . . . . . 76,419 77,507 76,198
Total operating revenues . . . . . . . . . . . . . . . . . . . . . . . . . . . . . . . . . . . . . . . . . . . . . . . . 11,024,486 11,686,135 10,914,922
Operating expenses
Electric fuel and purchased power . . . . . . . . . . . . . . . . . . . . . . . . . . . . . . . . . . . . . . . . . . . 3,762,953 4,210,142 4,018,672
Cost of natural gas sold and transported . . . . . . . . . . . . . . . . . . . . . . . . . . . . . . . . . . . . . . 904,794 1,372,479 1,082,751
Cost of sales — other . . . . . . . . . . . . . . . . . . . . . . . . . . . . . . . . . . . . . . . . . . . . . . . . . . . . . 36,216 34,352 33,323
Operating and maintenance expenses . . . . . . . . . . . . . . . . . . . . . . . . . . . . . . . . . . . . . . . . 2,329,670 2,334,379 2,273,532
Conservation and demand side management program expenses . . . . . . . . . . . . . . . . . . . . 224,679 301,772 260,726
Depreciation and amortization . . . . . . . . . . . . . . . . . . . . . . . . . . . . . . . . . . . . . . . . . . . . . . 1,124,524 1,019,045 977,863
Taxes (other than income taxes). . . . . . . . . . . . . . . . . . . . . . . . . . . . . . . . . . . . . . . . . . . . . 511,675 465,836 420,500
Loss on Monticello life cycle management/extended power uprate project . . . . . . . . . . . 129,463 — —
Total operating expenses. . . . . . . . . . . . . . . . . . . . . . . . . . . . . . . . . . . . . . . . . . . . . . . . 9,023,974 9,738,005 9,067,367
Operating income . . . . . . . . . . . . . . . . . . . . . . . . . . . . . . . . . . . . . . . . . . . . . . . . . . . . . . . . 2,000,512 1,948,130 1,847,555
Other income, net . . . . . . . . . . . . . . . . . . . . . . . . . . . . . . . . . . . . . . . . . . . . . . . . . . . . . . . . . 5,400 5,296 2,972
Equity earnings of unconsolidated subsidiaries . . . . . . . . . . . . . . . . . . . . . . . . . . . . . . . . . . 34,390 30,151 30,020
Allowance for funds used during construction — equity. . . . . . . . . . . . . . . . . . . . . . . . . . . 55,936 89,750 87,683
Interest charges and financing costs
Interest charges — includes other financing costs of $24,175, $22,986 and
$30,135, respectively . . . . . . . . . . . . . . . . . . . . . . . . . . . . . . . . . . . . . . . . . . . . . . . . . . . 595,282 566,608 575,199
Allowance for funds used during construction — debt . . . . . . . . . . . . . . . . . . . . . . . . . . . (26,248)(38,402) (39,179)
Total interest charges and financing costs. . . . . . . . . . . . . . . . . . . . . . . . . . . . . . . . . . . 569,034 528,206 536,020
Income before income taxes. . . . . . . . . . . . . . . . . . . . . . . . . . . . . . . . . . . . . . . . . . . . . . . . 1,527,204 1,545,121 1,432,210
Income taxes. . . . . . . . . . . . . . . . . . . . . . . . . . . . . . . . . . . . . . . . . . . . . . . . . . . . . . . . . . . . . 542,719 523,815 483,976
Net income. . . . . . . . . . . . . . . . . . . . . . . . . . . . . . . . . . . . . . . . . . . . . . . . . . . . . . . . . . . . . . $ 984,485 $ 1,021,306 $ 948,234
Weighted average common shares outstanding:
Basic. . . . . . . . . . . . . . . . . . . . . . . . . . . . . . . . . . . . . . . . . . . . . . . . . . . . . . . . . . . . . . . . . . 507,768 503,847 496,073
Diluted . . . . . . . . . . . . . . . . . . . . . . . . . . . . . . . . . . . . . . . . . . . . . . . . . . . . . . . . . . . . . . . . 508,168 504,117 496,532
Earnings per average common share:
Basic. . . . . . . . . . . . . . . . . . . . . . . . . . . . . . . . . . . . . . . . . . . . . . . . . . . . . . . . . . . . . . . . . . $ 1.94 $ 2.03 $ 1.91
Diluted . . . . . . . . . . . . . . . . . . . . . . . . . . . . . . . . . . . . . . . . . . . . . . . . . . . . . . . . . . . . . . . . 1.94 2.03 1.91
Cash dividends declared per common share . . . . . . . . . . . . . . . . . . . . . . . . . . . . . . . . . . $ 1.28 $ 1.20 $ 1.11
See Notes to Consolidated Financial Statements