Xcel Energy 2015 Annual Report Download - page 123
Download and view the complete annual report
Please find page 123 of the 2015 Xcel Energy annual report below. You can navigate through the pages in the report by either clicking on the pages listed below, or by using the keyword search tool below to find specific information within the annual report.-
 1
1 -
2
-
3
-
4
-
5
-
6
-
7
-
8
-
9
-
10
-
11
-
12
-
13
-
14
-
15
-
16
-
17
-
18
-
19
-
20
-
21
-
22
-
23
-
24
-
25
-
26
-
27
-
28
-
29
-
30
-
31
-
32
-
33
-
34
-
35
-
36
-
37
-
38
-
39
-
40
-
41
-
42
-
43
-
44
-
45
-
46
-
47
-
48
-
49
-
50
-
51
-
52
-
53
-
54
-
55
-
56
-
57
-
58
-
59
-
60
-
61
-
62
-
63
-
64
-
65
-
66
-
67
-
68
-
69
-
70
-
71
-
72
-
73
-
74
-
75
-
76
-
77
-
78
-
79
-
80
-
81
-
82
-
83
-
84
-
85
-
86
-
87
-
88
-
89
-
90
-
91
-
92
-
93
-
94
-
95
-
96
-
97
-
98
-
99
-
100
-
101
-
102
-
103
-
104
-
105
-
106
-
107
-
108
-
109
-
110
-
111
-
112
-
 113
113 -
 114
114 -
 115
115 -
 116
116 -
 117
117 -
 118
118 -
 119
119 -
 120
120 -
 121
121 -
 122
122 -
 123
123 -
 124
124 -
 125
125 -
 126
126 -
 127
127 -
 128
128 -
 129
129 -
 130
130 -
 131
131 -
 132
132 -
 133
133 -
134
-
135
-
136
-
137
-
138
-
139
-
140
-
141
-
142
-
143
-
144
-
145
-
146
-
147
-
148
-
149
-
150
-
151
-
152
-
153
-
154
-
155
-
156
-
157
-
158
-
159
-
160
-
161
-
162
-
163
-
164
-
165
-
166
-
167
-
168
-
169
-
170
-
171
-
172
-
173
-
174
-
175
-
176
-
177
-
178
-
179
-
180
 |
 |

105
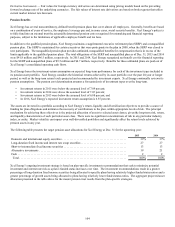
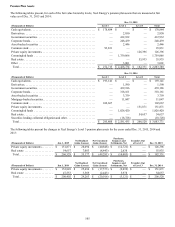
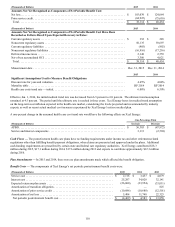
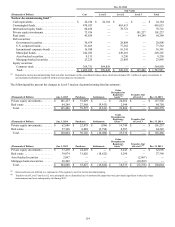
Pension Plan Assets
The following tables present, for each of the fair value hierarchy levels, Xcel Energy’s pension plan assets that are measured at fair
value as of Dec. 31, 2015 and 2014:
Dec. 31, 2015
(Thousands of Dollars) Level 1 Level 2 Level 3 Total
Cash equivalents . . . . . . . . . . . . . . . . . . . . . . . . . . . . . . . . . . . . . . . . . . . . . $ 178,884 $ — $ — $ 178,884
Derivatives. . . . . . . . . . . . . . . . . . . . . . . . . . . . . . . . . . . . . . . . . . . . . . . . . . — 2,850 — 2,850
Government securities. . . . . . . . . . . . . . . . . . . . . . . . . . . . . . . . . . . . . . . . . — 412,932 — 412,932
Corporate bonds. . . . . . . . . . . . . . . . . . . . . . . . . . . . . . . . . . . . . . . . . . . . . . — 248,439 — 248,439
Asset-backed securities . . . . . . . . . . . . . . . . . . . . . . . . . . . . . . . . . . . . . . . . — 2,446 — 2,446
Common stock. . . . . . . . . . . . . . . . . . . . . . . . . . . . . . . . . . . . . . . . . . . . . . . 93,831 — — 93,831
Private equity investments. . . . . . . . . . . . . . . . . . . . . . . . . . . . . . . . . . . . . . — — 126,396 126,396
Commingled funds . . . . . . . . . . . . . . . . . . . . . . . . . . . . . . . . . . . . . . . . . . . — 1,759,066 — 1,759,066
Real estate . . . . . . . . . . . . . . . . . . . . . . . . . . . . . . . . . . . . . . . . . . . . . . . . . . — — 55,935 55,935
Other . . . . . . . . . . . . . . . . . . . . . . . . . . . . . . . . . . . . . . . . . . . . . . . . . . . . . . — 3,001 — 3,001
Total. . . . . . . . . . . . . . . . . . . . . . . . . . . . . . . . . . . . . . . . . . . . . . . . . . . . . . $ 272,715 $ 2,428,734 $ 182,331 $ 2,883,780
Dec. 31, 2014
(Thousands of Dollars) Level 1 Level 2 Level 3 Total
Cash equivalents . . . . . . . . . . . . . . . . . . . . . . . . . . . . . . . . . . . . . . . . . . . . . $ 193,141 $ — $ — $ 193,141
Derivatives. . . . . . . . . . . . . . . . . . . . . . . . . . . . . . . . . . . . . . . . . . . . . . . . . . — 1,590 — 1,590
Government securities. . . . . . . . . . . . . . . . . . . . . . . . . . . . . . . . . . . . . . . . . — 439,186 — 439,186
Corporate bonds. . . . . . . . . . . . . . . . . . . . . . . . . . . . . . . . . . . . . . . . . . . . . . — 318,161 — 318,161
Asset-backed securities . . . . . . . . . . . . . . . . . . . . . . . . . . . . . . . . . . . . . . . . — 3,759 — 3,759
Mortgage-backed securities. . . . . . . . . . . . . . . . . . . . . . . . . . . . . . . . . . . . . — 11,047 — 11,047
Common stock. . . . . . . . . . . . . . . . . . . . . . . . . . . . . . . . . . . . . . . . . . . . . . . 102,667 — — 102,667
Private equity investments. . . . . . . . . . . . . . . . . . . . . . . . . . . . . . . . . . . . . . — — 151,871 151,871
Commingled funds . . . . . . . . . . . . . . . . . . . . . . . . . . . . . . . . . . . . . . . . . . . — 1,826,420 — 1,826,420
Real estate . . . . . . . . . . . . . . . . . . . . . . . . . . . . . . . . . . . . . . . . . . . . . . . . . . — — 54,657 54,657
Securities lending collateral obligation and other . . . . . . . . . . . . . . . . . . . . — (18,728) — (18,728)
Total. . . . . . . . . . . . . . . . . . . . . . . . . . . . . . . . . . . . . . . . . . . . . . . . . . . . . . $ 295,808 $ 2,581,435 $ 206,528 $ 3,083,771
The following tables present the changes in Xcel Energy’s Level 3 pension plan assets for the years ended Dec. 31, 2015, 2014 and
2013:
(Thousands of Dollars) Jan. 1, 2015 Net Realized
Gains (Losses) Net Unrealized
Gains (Losses)
Purchases,
Issuances and
Settlements, Net Transfers Out
of Level 3 Dec. 31, 2015
Private equity investments. . . . . . . . $ 151,871 $ 28,094 $ (40,848) $ (12,721) $ — $ 126,396
Real estate . . . . . . . . . . . . . . . . . . . . 54,657 7,083 (8,443) 2,638 — 55,935
Total. . . . . . . . . . . . . . . . . . . . . . . . $ 206,528 $ 35,177 $ (49,291) $ (10,083) $ — $ 182,331
(Thousands of Dollars) Jan. 1, 2014 Net Realized
Gains (Losses) Net Unrealized
Gains (Losses)
Purchases,
Issuances and
Settlements, Net Transfers Out
of Level 3 Dec. 31, 2014
Private equity investments. . . . . . . . $ 152,849 $ 25,694 $ (17,573) $ (9,099) $ — $ 151,871
Real estate . . . . . . . . . . . . . . . . . . . . 47,553 3,569 (2,443) 5,978 — 54,657
Total. . . . . . . . . . . . . . . . . . . . . . . . $ 200,402 $ 29,263 $ (20,016) $ (3,121) $ — $ 206,528