Xcel Energy 2015 Annual Report Download - page 177
Download and view the complete annual report
Please find page 177 of the 2015 Xcel Energy annual report below. You can navigate through the pages in the report by either clicking on the pages listed below, or by using the keyword search tool below to find specific information within the annual report.-
 1
1 -
2
-
3
-
4
-
5
-
6
-
7
-
8
-
9
-
10
-
11
-
12
-
13
-
14
-
15
-
16
-
17
-
18
-
19
-
20
-
21
-
22
-
23
-
24
-
25
-
26
-
27
-
28
-
29
-
30
-
31
-
32
-
33
-
34
-
35
-
36
-
37
-
38
-
39
-
40
-
41
-
42
-
43
-
44
-
45
-
46
-
47
-
48
-
49
-
50
-
51
-
52
-
53
-
54
-
55
-
56
-
57
-
58
-
59
-
60
-
61
-
62
-
63
-
64
-
65
-
66
-
67
-
68
-
69
-
70
-
71
-
72
-
73
-
74
-
75
-
76
-
77
-
78
-
79
-
80
-
81
-
82
-
83
-
84
-
85
-
86
-
87
-
88
-
89
-
90
-
91
-
92
-
93
-
94
-
95
-
96
-
97
-
98
-
99
-
100
-
101
-
102
-
103
-
104
-
105
-
106
-
107
-
108
-
109
-
110
-
111
-
112
-
113
-
114
-
115
-
116
-
117
-
118
-
119
-
120
-
121
-
122
-
123
-
124
-
125
-
126
-
127
-
128
-
129
-
130
-
131
-
132
-
133
-
134
-
135
-
136
-
137
-
138
-
139
-
140
-
141
-
142
-
143
-
144
-
145
-
146
-
147
-
148
-
149
-
150
-
151
-
152
-
153
-
154
-
155
-
156
-
157
-
158
-
159
-
160
-
161
-
162
-
163
-
164
-
165
-
166
-
 167
167 -
 168
168 -
 169
169 -
 170
170 -
 171
171 -
 172
172 -
 173
173 -
 174
174 -
 175
175 -
 176
176 -
 177
177 -
 178
178 -
 179
179 -
 180
180
 |
 |

159
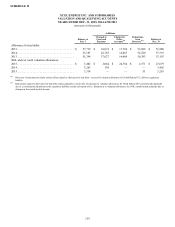
SCHEDULE II
XCEL ENERGY INC. AND SUBSIDIARIES
VALUATION AND QUALIFYING ACCOUNTS
YEARS ENDED DEC. 31, 2015, 2014 AND 2013
(amounts in thousands)
Additions
Balance at
Jan. 1
Charged to
Costs and
Expenses
Charged to
Other
Accounts(a)
Deductions
from
Reserves(b) Balance at
Dec. 31
Allowance for bad debts:
2015. . . . . . . . . . . . . . . . . . . . . . . . . . . . . . . . . . . . . . . . $ 57,719 $ 36,074 $ 11,784 $ 53,689 $ 51,888
2014. . . . . . . . . . . . . . . . . . . . . . . . . . . . . . . . . . . . . . . . 53,107 42,765 14,067 52,220 57,719
2013. . . . . . . . . . . . . . . . . . . . . . . . . . . . . . . . . . . . . . . . 51,394 37,627 14,469 50,383 53,107
NOL and tax credit valuation allowances:
2015. . . . . . . . . . . . . . . . . . . . . . . . . . . . . . . . . . . . . . . . $ 3,402 $ 2,064 $ 24,784 $ 2,571 $ 27,679
2014. . . . . . . . . . . . . . . . . . . . . . . . . . . . . . . . . . . . . . . . 3,263 139 — — 3,402
2013. . . . . . . . . . . . . . . . . . . . . . . . . . . . . . . . . . . . . . . . 3,314 — — 51 3,263
(a) Recovery of amounts previously written off as related to allowance for bad debts. Accrual of valuation allowance for North Dakota ITC, offset to regulatory
liability.
(b) Deductions related to allowance for bad debts relates primarily to write-offs. Reductions to valuation allowances for North Dakota ITC carryforwards primarily
due to a consolidated adjustment to the regulatory liability accrual referenced above. Reductions to valuation allowances for NOL carryforwards primarily due to
changes in forecasted taxable income.