Xcel Energy 2015 Annual Report Download - page 72
Download and view the complete annual report
Please find page 72 of the 2015 Xcel Energy annual report below. You can navigate through the pages in the report by either clicking on the pages listed below, or by using the keyword search tool below to find specific information within the annual report.-
 1
1 -
2
-
3
-
4
-
5
-
6
-
7
-
8
-
9
-
10
-
11
-
12
-
13
-
14
-
15
-
16
-
17
-
18
-
19
-
20
-
21
-
22
-
23
-
24
-
25
-
26
-
27
-
28
-
29
-
30
-
31
-
32
-
33
-
34
-
35
-
36
-
37
-
38
-
39
-
40
-
41
-
42
-
43
-
44
-
45
-
46
-
47
-
48
-
49
-
50
-
51
-
52
-
53
-
54
-
55
-
56
-
57
-
58
-
59
-
60
-
61
-
 62
62 -
 63
63 -
 64
64 -
 65
65 -
 66
66 -
 67
67 -
 68
68 -
 69
69 -
 70
70 -
 71
71 -
 72
72 -
 73
73 -
 74
74 -
 75
75 -
 76
76 -
 77
77 -
 78
78 -
 79
79 -
 80
80 -
 81
81 -
 82
82 -
83
-
84
-
85
-
86
-
87
-
88
-
89
-
90
-
91
-
92
-
93
-
94
-
95
-
96
-
97
-
98
-
99
-
100
-
101
-
102
-
103
-
104
-
105
-
106
-
107
-
108
-
109
-
110
-
111
-
112
-
113
-
114
-
115
-
116
-
117
-
118
-
119
-
120
-
121
-
122
-
123
-
124
-
125
-
126
-
127
-
128
-
129
-
130
-
131
-
132
-
133
-
134
-
135
-
136
-
137
-
138
-
139
-
140
-
141
-
142
-
143
-
144
-
145
-
146
-
147
-
148
-
149
-
150
-
151
-
152
-
153
-
154
-
155
-
156
-
157
-
158
-
159
-
160
-
161
-
162
-
163
-
164
-
165
-
166
-
167
-
168
-
169
-
170
-
171
-
172
-
173
-
174
-
175
-
176
-
177
-
178
-
179
-
180
 |
 |

54
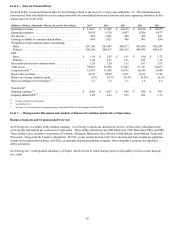
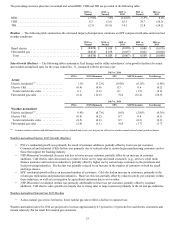
2014 v. 2013
PSCo NSP-Minnesota SPS NSP-Wisconsin Xcel Energy
Actual
Electric residential (a) . . . . . . . . . . . . . . . . . . . (2.8)% (1.6)% (0.4)% (0.3)% (1.8)%
Electric C&I. . . . . . . . . . . . . . . . . . . . . . . . . . 0.3 — 2.5 4.2 1.0
Total retail electric sales . . . . . . . . . . . . . . . (0.7) (0.5) 1.8 2.8 0.2
Firm natural gas sales . . . . . . . . . . . . . . . . . . (0.7) 7.3 N/A 7.4 2.3
2014 vs. 2013
PSCo NSP-Minnesota SPS NSP-Wisconsin Xcel Energy
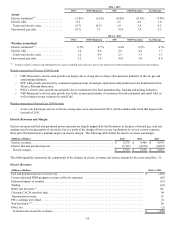
Weather-normalized
Electric residential (a) . . . . . . . . . . . . . . . . . . . 0.3% 0.7% 0.4% 0.5% 0.5%
Electric C&I. . . . . . . . . . . . . . . . . . . . . . . . . . 1.6 0.6 2.8 4.4 1.7
Total retail electric sales . . . . . . . . . . . . . . . 1.2 0.6 2.3 3.3 1.3
Firm natural gas sales . . . . . . . . . . . . . . . . . . 5.2 3.6 N/A 3.8 4.6
(a) Extreme weather variations and additional factors such as windchill and cloud cover may not be reflected in weather-normalized and actual growth estimates.
Weather-normalized Electric 2014 Growth
• NSP-Wisconsin’s electric sales growth was largely due to strong sales to large C&I customers primarily in the oil, gas and
sand mining industries.
• SPS’ C&I growth was driven by continued expansion from oil and gas exploration and production in the Southeastern New
Mexico, Permian Basin area.
• PSCo’s electric sales growth was primarily due to customers in the food manufacturing, fracking and mining industries.
• NSP-Minnesota’s electric sales growth was led by an increased number of customers for both residential and small C&I, as
well as higher use per customer in small C&I.
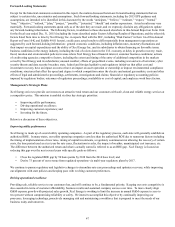
Weather-normalized Natural Gas 2014 Growth
• Across our natural gas service territories, strong sales were experienced in 2014, which continued the trend that began in the
last half of 2013.
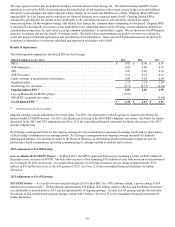
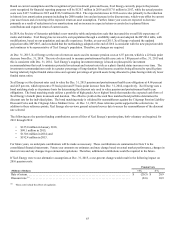
Electric Revenues and Margin
Electric revenues and fuel and purchased power expenses are largely impacted by the fluctuation in the price of natural gas, coal and
uranium used in the generation of electricity, but as a result of the design of fuel recovery mechanisms to recover current expenses,
these price fluctuations have minimal impact on electric margin. The following table details the electric revenues and margin:
(Millions of Dollars) 2015 2014 2013
Electric revenues . . . . . . . . . . . . . . . . . . . . . . . . . . . . . . . . . . . . . . . . . . . . . . . . . . . . . . . . . $ 9,276 $ 9,466 $ 9,034
Electric fuel and purchased power . . . . . . . . . . . . . . . . . . . . . . . . . . . . . . . . . . . . . . . . . . . (3,763)(4,210) (4,019)
Electric margin . . . . . . . . . . . . . . . . . . . . . . . . . . . . . . . . . . . . . . . . . . . . . . . . . . . . . . . . . $ 5,513 $ 5,256 $ 5,015
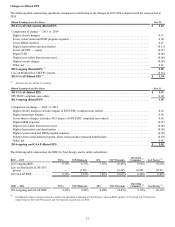
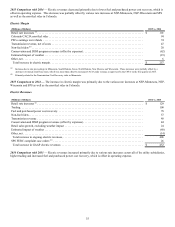
The following tables summarize the components of the changes in electric revenues and electric margin for the years ended Dec. 31:
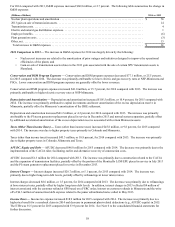
Electric Revenues
(Millions of Dollars) 2015 vs. 2014
Fuel and purchased power cost recovery. . . . . . . . . . . . . . . . . . . . . . . . . . . . . . . . . . . . . . . . . . . . . . . . . . . . . . . . . . . . $ (469)
Conservation and DSM program revenues (offset by expenses). . . . . . . . . . . . . . . . . . . . . . . . . . . . . . . . . . . . . . . . . . (62)
Estimated impact of weather . . . . . . . . . . . . . . . . . . . . . . . . . . . . . . . . . . . . . . . . . . . . . . . . . . . . . . . . . . . . . . . . . . . . . (23)
Trading. . . . . . . . . . . . . . . . . . . . . . . . . . . . . . . . . . . . . . . . . . . . . . . . . . . . . . . . . . . . . . . . . . . . . . . . . . . . . . . . . . . . . . (14)
Retail rate increases (a) . . . . . . . . . . . . . . . . . . . . . . . . . . . . . . . . . . . . . . . . . . . . . . . . . . . . . . . . . . . . . . . . . . . . . . . . . . 101
Colorado CACJA non-fuel rider . . . . . . . . . . . . . . . . . . . . . . . . . . . . . . . . . . . . . . . . . . . . . . . . . . . . . . . . . . . . . . . . . . 94
Transmission revenue . . . . . . . . . . . . . . . . . . . . . . . . . . . . . . . . . . . . . . . . . . . . . . . . . . . . . . . . . . . . . . . . . . . . . . . . . . 91
PSCo earnings test refund . . . . . . . . . . . . . . . . . . . . . . . . . . . . . . . . . . . . . . . . . . . . . . . . . . . . . . . . . . . . . . . . . . . . . . . 74
Non-fuel riders (b). . . . . . . . . . . . . . . . . . . . . . . . . . . . . . . . . . . . . . . . . . . . . . . . . . . . . . . . . . . . . . . . . . . . . . . . . . . . . . 20
Other, net . . . . . . . . . . . . . . . . . . . . . . . . . . . . . . . . . . . . . . . . . . . . . . . . . . . . . . . . . . . . . . . . . . . . . . . . . . . . . . . . . . . . (2)
Total decrease in electric revenues . . . . . . . . . . . . . . . . . . . . . . . . . . . . . . . . . . . . . . . . . . . . . . . . . . . . . . . . . . . . . . . $ (190)