Xcel Energy 2015 Annual Report Download - page 64
Download and view the complete annual report
Please find page 64 of the 2015 Xcel Energy annual report below. You can navigate through the pages in the report by either clicking on the pages listed below, or by using the keyword search tool below to find specific information within the annual report.-
 1
1 -
2
-
3
-
4
-
5
-
6
-
7
-
8
-
9
-
10
-
11
-
12
-
13
-
14
-
15
-
16
-
17
-
18
-
19
-
20
-
21
-
22
-
23
-
24
-
25
-
26
-
27
-
28
-
29
-
30
-
31
-
32
-
33
-
34
-
35
-
36
-
37
-
38
-
39
-
40
-
41
-
42
-
43
-
44
-
45
-
46
-
47
-
48
-
49
-
50
-
51
-
52
-
53
-
 54
54 -
 55
55 -
 56
56 -
 57
57 -
 58
58 -
 59
59 -
 60
60 -
 61
61 -
 62
62 -
 63
63 -
 64
64 -
 65
65 -
 66
66 -
 67
67 -
 68
68 -
 69
69 -
 70
70 -
 71
71 -
 72
72 -
 73
73 -
 74
74 -
75
-
76
-
77
-
78
-
79
-
80
-
81
-
82
-
83
-
84
-
85
-
86
-
87
-
88
-
89
-
90
-
91
-
92
-
93
-
94
-
95
-
96
-
97
-
98
-
99
-
100
-
101
-
102
-
103
-
104
-
105
-
106
-
107
-
108
-
109
-
110
-
111
-
112
-
113
-
114
-
115
-
116
-
117
-
118
-
119
-
120
-
121
-
122
-
123
-
124
-
125
-
126
-
127
-
128
-
129
-
130
-
131
-
132
-
133
-
134
-
135
-
136
-
137
-
138
-
139
-
140
-
141
-
142
-
143
-
144
-
145
-
146
-
147
-
148
-
149
-
150
-
151
-
152
-
153
-
154
-
155
-
156
-
157
-
158
-
159
-
160
-
161
-
162
-
163
-
164
-
165
-
166
-
167
-
168
-
169
-
170
-
171
-
172
-
173
-
174
-
175
-
176
-
177
-
178
-
179
-
180
 |
 |

46
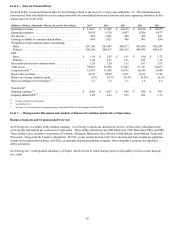
Item 6 — Selected Financial Data
Set forth below is selected financial data for Xcel Energy related to the most five recent years ended Dec. 31. This information has
been derived from and should be read in conjunction with the consolidated financial statements and notes appearing elsewhere in this
annual report on Form 10-K.
(Millions of Dollars, Thousands of Shares, Except Per Share Data) 2015 2014 2013 2012 2011
Operating revenues . . . . . . . . . . . . . . . . . . . . . . . . . . . . . . . . $ 11,025 $ 11,686 $ 10,915 $ 10,128 $ 10,655
Operating expenses . . . . . . . . . . . . . . . . . . . . . . . . . . . . . . . . 9,024 9,738 9,067 8,306 8,873
Net income. . . . . . . . . . . . . . . . . . . . . . . . . . . . . . . . . . . . . . . 984 1,021 948 905 841
Earnings available to common shareholders . . . . . . . . . . . . . 984 1,021 948 905 834
Weighted average common shares outstanding:
Basic . . . . . . . . . . . . . . . . . . . . . . . . . . . . . . . . . . . . . . . . . . 507,768 503,847 496,073 487,899 485,039
Diluted. . . . . . . . . . . . . . . . . . . . . . . . . . . . . . . . . . . . . . . . . 508,168 504,117 496,532 488,434 485,615
EPS:
Basic . . . . . . . . . . . . . . . . . . . . . . . . . . . . . . . . . . . . . . . . . . $ 1.94 $ 2.03 $ 1.91 $ 1.86 $ 1.72
Diluted. . . . . . . . . . . . . . . . . . . . . . . . . . . . . . . . . . . . . . . . . 1.94 2.03 1.91 1.85 1.72
Dividends declared per common share . . . . . . . . . . . . . . . . . 1.28 1.20 1.11 1.07 1.03
Total assets. . . . . . . . . . . . . . . . . . . . . . . . . . . . . . . . . . . . . . . 39,054 36,958 33,907 31,141 29,497
Long-term debt (a). . . . . . . . . . . . . . . . . . . . . . . . . . . . . . . . . . 12,491 11,500 10,911 10,144 8,849
Book value per share . . . . . . . . . . . . . . . . . . . . . . . . . . . . . . . 20.89 20.20 19.21 18.19 17.44
Return on average common equity . . . . . . . . . . . . . . . . . . . . 9.5% 10.3% 10.3% 10.4% 10.1%
Ratio of earnings to fixed charges (b) . . . . . . . . . . . . . . . . . . . 3.2 3.3 3.1 2.8 2.8
Non-GAAP:
Ongoing earnings (c) . . . . . . . . . . . . . . . . . . . . . . . . . . . . . . . . $ 1,064 $ 1,021 $ 968 $ 888 $ 841
Ongoing diluted EPS (c) . . . . . . . . . . . . . . . . . . . . . . . . . . . . . 2.09 2.03 1.95 1.82 1.72
(a) Includes capital lease obligations.
(b) See Exhibit 12.01.
(c) See Item 7 for reconciliations of ongoing earnings and diluted EPS to GAAP earnings and diluted EPS.
Item 7 — Management’s Discussion and Analysis of Financial Condition and Results of Operations
Business Segments and Organizational Overview
Xcel Energy Inc. is a public utility holding company. Xcel Energy’s operations included the activity of four utility subsidiaries that
serve electric and natural gas customers in eight states. These utility subsidiaries are NSP-Minnesota, NSP-Wisconsin, PSCo and SPS.
These utilities serve customers in portions of Colorado, Michigan, Minnesota, New Mexico, North Dakota, South Dakota, Texas and
Wisconsin. Along with the TransCo subsidiaries, WYCO, a joint venture formed with CIG to develop and lease natural gas pipelines,
storage and compression facilities, and WGI, an interstate natural gas pipeline company, these companies comprise the regulated
utility operations.
Xcel Energy Inc.’s nonregulated subsidiary is Eloigne, which invests in rental housing projects that qualify for low-income housing
tax credits.