Xcel Energy 2015 Annual Report Download - page 49
Download and view the complete annual report
Please find page 49 of the 2015 Xcel Energy annual report below. You can navigate through the pages in the report by either clicking on the pages listed below, or by using the keyword search tool below to find specific information within the annual report.-
 1
1 -
2
-
3
-
4
-
5
-
6
-
7
-
8
-
9
-
10
-
11
-
12
-
13
-
14
-
15
-
16
-
17
-
18
-
19
-
20
-
21
-
22
-
23
-
24
-
25
-
26
-
27
-
28
-
29
-
30
-
31
-
32
-
33
-
34
-
35
-
36
-
37
-
38
-
 39
39 -
 40
40 -
 41
41 -
 42
42 -
 43
43 -
 44
44 -
 45
45 -
 46
46 -
 47
47 -
 48
48 -
 49
49 -
 50
50 -
 51
51 -
 52
52 -
 53
53 -
 54
54 -
 55
55 -
 56
56 -
 57
57 -
 58
58 -
 59
59 -
60
-
61
-
62
-
63
-
64
-
65
-
66
-
67
-
68
-
69
-
70
-
71
-
72
-
73
-
74
-
75
-
76
-
77
-
78
-
79
-
80
-
81
-
82
-
83
-
84
-
85
-
86
-
87
-
88
-
89
-
90
-
91
-
92
-
93
-
94
-
95
-
96
-
97
-
98
-
99
-
100
-
101
-
102
-
103
-
104
-
105
-
106
-
107
-
108
-
109
-
110
-
111
-
112
-
113
-
114
-
115
-
116
-
117
-
118
-
119
-
120
-
121
-
122
-
123
-
124
-
125
-
126
-
127
-
128
-
129
-
130
-
131
-
132
-
133
-
134
-
135
-
136
-
137
-
138
-
139
-
140
-
141
-
142
-
143
-
144
-
145
-
146
-
147
-
148
-
149
-
150
-
151
-
152
-
153
-
154
-
155
-
156
-
157
-
158
-
159
-
160
-
161
-
162
-
163
-
164
-
165
-
166
-
167
-
168
-
169
-
170
-
171
-
172
-
173
-
174
-
175
-
176
-
177
-
178
-
179
-
180
 |
 |

31
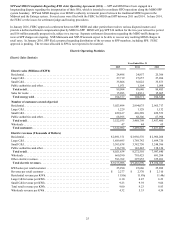
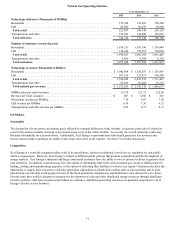
Natural Gas Operating Statistics
Year Ended Dec. 31
2015 2014 2013
Natural gas deliveries (Thousands of MMBtu)
Residential . . . . . . . . . . . . . . . . . . . . . . . . . . . . . . . . . . . . . . . . . . . . . . . . . . . . . . . . . . . . . 135,394 152,269 150,280
C&I . . . . . . . . . . . . . . . . . . . . . . . . . . . . . . . . . . . . . . . . . . . . . . . . . . . . . . . . . . . . . . . . . . . 86,093 95,879 92,849
Total retail. . . . . . . . . . . . . . . . . . . . . . . . . . . . . . . . . . . . . . . . . . . . . . . . . . . . . . . . . . . . 221,487 248,148 243,129
Transportation and other. . . . . . . . . . . . . . . . . . . . . . . . . . . . . . . . . . . . . . . . . . . . . . . . . . . 125,263 124,000 125,057
Total deliveries . . . . . . . . . . . . . . . . . . . . . . . . . . . . . . . . . . . . . . . . . . . . . . . . . . . . . . . . 346,750 372,148 368,186
Number of customers at end of period
Residential . . . . . . . . . . . . . . . . . . . . . . . . . . . . . . . . . . . . . . . . . . . . . . . . . . . . . . . . . . . . . 1,814,321 1,795,190 1,776,849
C&I . . . . . . . . . . . . . . . . . . . . . . . . . . . . . . . . . . . . . . . . . . . . . . . . . . . . . . . . . . . . . . . . . . . 156,306 155,515 154,646
Total retail. . . . . . . . . . . . . . . . . . . . . . . . . . . . . . . . . . . . . . . . . . . . . . . . . . . . . . . . . . . . 1,970,627 1,950,705 1,931,495
Transportation and other. . . . . . . . . . . . . . . . . . . . . . . . . . . . . . . . . . . . . . . . . . . . . . . . . . . 6,981 6,594 6,320
Total customers. . . . . . . . . . . . . . . . . . . . . . . . . . . . . . . . . . . . . . . . . . . . . . . . . . . . . . . . 1,977,608 1,957,299 1,937,815
Natural gas revenues (Thousands of Dollars)
Residential . . . . . . . . . . . . . . . . . . . . . . . . . . . . . . . . . . . . . . . . . . . . . . . . . . . . . . . . . . . . . $ 1,042,884 $ 1,320,207 $ 1,126,859
C&I . . . . . . . . . . . . . . . . . . . . . . . . . . . . . . . . . . . . . . . . . . . . . . . . . . . . . . . . . . . . . . . . . . . 547,165 727,071 586,548
Total retail. . . . . . . . . . . . . . . . . . . . . . . . . . . . . . . . . . . . . . . . . . . . . . . . . . . . . . . . . . . . 1,590,049 2,047,278 1,713,407
Transportation and other. . . . . . . . . . . . . . . . . . . . . . . . . . . . . . . . . . . . . . . . . . . . . . . . . . . 82,032 95,460 91,272
Total natural gas revenues. . . . . . . . . . . . . . . . . . . . . . . . . . . . . . . . . . . . . . . . . . . . . . . $ 1,672,081 $ 2,142,738 $ 1,804,679
MMBtu sales per retail customer . . . . . . . . . . . . . . . . . . . . . . . . . . . . . . . . . . . . . . . . . . . . 112.39 127.21 125.88
Revenue per retail customer . . . . . . . . . . . . . . . . . . . . . . . . . . . . . . . . . . . . . . . . . . . . . . . . $ 807 $ 1,050 $ 887
Residential revenue per MMBtu. . . . . . . . . . . . . . . . . . . . . . . . . . . . . . . . . . . . . . . . . . . . . 7.70 8.67 7.50
C&I revenue per MMBtu . . . . . . . . . . . . . . . . . . . . . . . . . . . . . . . . . . . . . . . . . . . . . . . . . . 6.36 7.58 6.32
Transportation and other revenue per MMBtu. . . . . . . . . . . . . . . . . . . . . . . . . . . . . . . . . . 0.65 0.77 0.73
GENERAL
Seasonality
The demand for electric power and natural gas is affected by seasonal differences in the weather. In general, peak sales of electricity
occur in the summer months, and peak sales of natural gas occur in the winter months. As a result, the overall operating results may
fluctuate substantially on a seasonal basis. Additionally, Xcel Energy’s operations have historically generated less revenues and
income when weather conditions are milder in the winter and cooler in the summer. See Item 7 for further discussion.
Competition
Xcel Energy is a vertically integrated utility in all of its jurisdictions, subject to traditional cost-of-service regulation by state public
utilities commissions. However, Xcel Energy is subject to different public policies that promote competition and the development of
energy markets. Xcel Energy’s industrial and large commercial customers have the ability to own or operate facilities to generate their
own electricity. In addition, customers may have the option of substituting other fuels, such as natural gas, steam or chilled water for
heating, cooling and manufacturing purposes, or the option of relocating their facilities to a lower cost region. Customers also have the
opportunity to supply their own power with solar generation (depending on jurisdiction, rooftop solar or solar gardens) and in most
jurisdictions can currently avoid paying for most of the fixed production, transmission and distribution costs incurred to serve them.
Several states have policies designed to promote the development of solar and other distributed energy resources through significant
incentive policies; with these incentives and federal tax subsidies, distributed generating resources are potential competitors to Xcel
Energy’s electric service business.