Xcel Energy 2015 Annual Report Download - page 87
Download and view the complete annual report
Please find page 87 of the 2015 Xcel Energy annual report below. You can navigate through the pages in the report by either clicking on the pages listed below, or by using the keyword search tool below to find specific information within the annual report.-
 1
1 -
2
-
3
-
4
-
5
-
6
-
7
-
8
-
9
-
10
-
11
-
12
-
13
-
14
-
15
-
16
-
17
-
18
-
19
-
20
-
21
-
22
-
23
-
24
-
25
-
26
-
27
-
28
-
29
-
30
-
31
-
32
-
33
-
34
-
35
-
36
-
37
-
38
-
39
-
40
-
41
-
42
-
43
-
44
-
45
-
46
-
47
-
48
-
49
-
50
-
51
-
52
-
53
-
54
-
55
-
56
-
57
-
58
-
59
-
60
-
61
-
62
-
63
-
64
-
65
-
66
-
67
-
68
-
69
-
70
-
71
-
72
-
73
-
74
-
75
-
76
-
 77
77 -
 78
78 -
 79
79 -
 80
80 -
 81
81 -
 82
82 -
 83
83 -
 84
84 -
 85
85 -
 86
86 -
 87
87 -
 88
88 -
 89
89 -
 90
90 -
 91
91 -
 92
92 -
 93
93 -
 94
94 -
 95
95 -
 96
96 -
 97
97 -
98
-
99
-
100
-
101
-
102
-
103
-
104
-
105
-
106
-
107
-
108
-
109
-
110
-
111
-
112
-
113
-
114
-
115
-
116
-
117
-
118
-
119
-
120
-
121
-
122
-
123
-
124
-
125
-
126
-
127
-
128
-
129
-
130
-
131
-
132
-
133
-
134
-
135
-
136
-
137
-
138
-
139
-
140
-
141
-
142
-
143
-
144
-
145
-
146
-
147
-
148
-
149
-
150
-
151
-
152
-
153
-
154
-
155
-
156
-
157
-
158
-
159
-
160
-
161
-
162
-
163
-
164
-
165
-
166
-
167
-
168
-
169
-
170
-
171
-
172
-
173
-
174
-
175
-
176
-
177
-
178
-
179
-
180
 |
 |

69
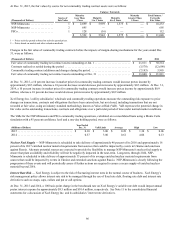
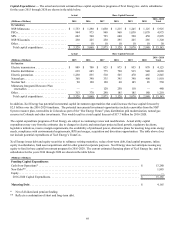
Capital Expenditures — The actual and current estimated base capital expenditure programs of Xcel Energy Inc. and its subsidiaries
for the years 2015 through 2020 are shown in the table below.
Actual Base Capital Forecast
(Millions of Dollars) 2015 2016 2017 2018 2019 2020 2016 - 2020
Total
By Subsidiary
NSP-Minnesota . . . . . . . . . . . . . . . . . . . . . . . . . $ 1,753 $ 1,290 $ 1,050 $ 1,215 $ 1,245 $ 1,125 $ 5,925
PSCo. . . . . . . . . . . . . . . . . . . . . . . . . . . . . . . . . . 944 975 940 960 1,030 1,070 4,975
SPS . . . . . . . . . . . . . . . . . . . . . . . . . . . . . . . . . . . 602 560 725 640 520 450 2,895
NSP-Wisconsin. . . . . . . . . . . . . . . . . . . . . . . . . . 230 225 250 295 265 285 1,320
Other. . . . . . . . . . . . . . . . . . . . . . . . . . . . . . . . . . — 10 10 10 10 10 50
Total capital expenditures . . . . . . . . . . . . . . . . $ 3,529 $ 3,060 $ 2,975 $ 3,120 $ 3,070 $ 2,940 $ 15,165
Actual Base Capital Forecast
(Millions of Dollars) 2015 2016 2017 2018 2019 2020 2016 - 2020
Total
By Function
Electric transmission . . . . . . . . . . . . . . . . . . . . . $ 889 $ 700 $ 825 $ 875 $ 855 $ 870 $ 4,125
Electric distribution . . . . . . . . . . . . . . . . . . . . . . 639 645 775 790 915 940 4,065
Electric generation . . . . . . . . . . . . . . . . . . . . . . . 1,230 835 510 565 470 465 2,845
Natural gas . . . . . . . . . . . . . . . . . . . . . . . . . . . . . 368 390 335 395 390 400 1,910
Nuclear fuel . . . . . . . . . . . . . . . . . . . . . . . . . . . . 90 120 120 60 145 85 530
Minnesota Integrated Resource Plan
renewables . . . . . . . . . . . . . . . . . . . . . . . . . . . — — 120 250 110 — 480
Other. . . . . . . . . . . . . . . . . . . . . . . . . . . . . . . . . . 313 370 290 185 185 180 1,210
Total capital expenditures . . . . . . . . . . . . . . . . $ 3,529 $ 3,060 $ 2,975 $ 3,120 $ 3,070 $ 2,940 $ 15,165
In addition, Xcel Energy has potential incremental capital investment opportunities that could increase the base capital forecast by
$2.5 billion over the 2016-2020 timeframe. The potential incremental investment opportunities include renewables from the NSP
System resource plan, renewables in Colorado as part of the “Our Energy Future” plan, distribution grid modernization, natural gas
reserves in Colorado and other investments. This would result in a total capital forecast of $17.7 billion for 2016-2020.
The capital expenditure programs of Xcel Energy are subject to continuing review and modification. Actual utility capital
expenditures may vary from the estimates due to changes in electric and natural gas projected load growth, regulatory decisions,
legislative initiatives, reserve margin requirements, the availability of purchased power, alternative plans for meeting long-term energy
needs, compliance with environmental requirements, RPS and merger, acquisition and divestiture opportunities. The table above does
not include potential expenditures of Xcel Energy’s TransCos.
Xcel Energy issues debt and equity securities to refinance retiring maturities, reduce short-term debt, fund capital programs, infuse
equity in subsidiaries, fund asset acquisitions and for other general corporate purposes. Xcel Energy does not anticipate issuing any
equity to fund its base capital investment program for 2016-2020. The current estimated financing plans of Xcel Energy Inc. and its
subsidiaries for the years 2016 through 2020 are shown in the table below.
(Millions of Dollars)
Funding Capital Expenditures
Cash from Operations* . . . . . . . . . . . . . . . . . . . . . . . . . . . . . . . . . . . . . . . . . . . . . . . . . . . . . . . . . . . . . . . . . . . . . . $ 13,280
New Debt** . . . . . . . . . . . . . . . . . . . . . . . . . . . . . . . . . . . . . . . . . . . . . . . . . . . . . . . . . . . . . . . . . . . . . . . . . . . . . . . 1,885
Equity. . . . . . . . . . . . . . . . . . . . . . . . . . . . . . . . . . . . . . . . . . . . . . . . . . . . . . . . . . . . . . . . . . . . . . . . . . . . . . . . . . . . —
2016-2020 Capital Expenditures. . . . . . . . . . . . . . . . . . . . . . . . . . . . . . . . . . . . . . . . . . . . . . . . . . . . . . . . . . . . . . $ 15,165
Maturing Debt . . . . . . . . . . . . . . . . . . . . . . . . . . . . . . . . . . . . . . . . . . . . . . . . . . . . . . . . . . . . . . . . . . . . . . . . . . . . $ 4,165
* Net of dividend and pension funding.
** Reflects a combination of short and long-term debt.