Xcel Energy 2015 Annual Report Download - page 84
Download and view the complete annual report
Please find page 84 of the 2015 Xcel Energy annual report below. You can navigate through the pages in the report by either clicking on the pages listed below, or by using the keyword search tool below to find specific information within the annual report.-
 1
1 -
2
-
3
-
4
-
5
-
6
-
7
-
8
-
9
-
10
-
11
-
12
-
13
-
14
-
15
-
16
-
17
-
18
-
19
-
20
-
21
-
22
-
23
-
24
-
25
-
26
-
27
-
28
-
29
-
30
-
31
-
32
-
33
-
34
-
35
-
36
-
37
-
38
-
39
-
40
-
41
-
42
-
43
-
44
-
45
-
46
-
47
-
48
-
49
-
50
-
51
-
52
-
53
-
54
-
55
-
56
-
57
-
58
-
59
-
60
-
61
-
62
-
63
-
64
-
65
-
66
-
67
-
68
-
69
-
70
-
71
-
72
-
73
-
 74
74 -
 75
75 -
 76
76 -
 77
77 -
 78
78 -
 79
79 -
 80
80 -
 81
81 -
 82
82 -
 83
83 -
 84
84 -
 85
85 -
 86
86 -
 87
87 -
 88
88 -
 89
89 -
 90
90 -
 91
91 -
 92
92 -
 93
93 -
 94
94 -
95
-
96
-
97
-
98
-
99
-
100
-
101
-
102
-
103
-
104
-
105
-
106
-
107
-
108
-
109
-
110
-
111
-
112
-
113
-
114
-
115
-
116
-
117
-
118
-
119
-
120
-
121
-
122
-
123
-
124
-
125
-
126
-
127
-
128
-
129
-
130
-
131
-
132
-
133
-
134
-
135
-
136
-
137
-
138
-
139
-
140
-
141
-
142
-
143
-
144
-
145
-
146
-
147
-
148
-
149
-
150
-
151
-
152
-
153
-
154
-
155
-
156
-
157
-
158
-
159
-
160
-
161
-
162
-
163
-
164
-
165
-
166
-
167
-
168
-
169
-
170
-
171
-
172
-
173
-
174
-
175
-
176
-
177
-
178
-
179
-
180
 |
 |

66
At Dec. 31, 2015, the fair values by source for net commodity trading contract assets were as follows:
Futures / Forwards
(Thousands of Dollars) Source of
Fair Value
Maturity
Less Than
1 Year Maturity
1 to 3 Years Maturity
4 to 5 Years
Maturity
Greater Than
5 Years
Total Futures /
Forwards
Fair Value
NSP-Minnesota . . . . . . . . . . . . . . . . 1 $ 2,699 $ 5,959 $ 1,575 $ — $ 10,233
NSP-Minnesota . . . . . . . . . . . . . . . . 2 695 — — — 695
PSCo. . . . . . . . . . . . . . . . . . . . . . . . . 1 128 (16) — — 112
$ 3,522 $ 5,943 $ 1,575 $ — $ 11,040
1 — Prices actively quoted or based on actively quoted prices.
2 — Prices based on models and other valuation methods.
Changes in the fair value of commodity trading contracts before the impacts of margin-sharing mechanisms for the years ended Dec.
31, were as follows:
(Thousands of Dollars) 2015 2014
Fair value of commodity trading net contract assets outstanding at Jan. 1 . . . . . . . . . . . . . . . . . . . . . . . . . $ 21,811 $ 30,514
Contracts realized or settled during the period . . . . . . . . . . . . . . . . . . . . . . . . . . . . . . . . . . . . . . . . . . . . . . (3,578) (12,698)
Commodity trading contract additions and changes during the period . . . . . . . . . . . . . . . . . . . . . . . . . . . . (7,193) 3,995
Fair value of commodity trading net contract assets outstanding at Dec. 31 . . . . . . . . . . . . . . . . . . . . . . . $ 11,040 $ 21,811
At Dec. 31, 2015, a 10 percent increase in market prices for commodity trading contracts would increase pretax income by
approximately $0.3 million, whereas a 10 percent decrease would decrease pretax income by approximately $0.3 million. At Dec. 31,
2014, a 10 percent increase in market prices for commodity trading contracts would increase pretax income by approximately $0.9
million, whereas a 10 percent decrease would decrease pretax income by approximately $0.9 million.
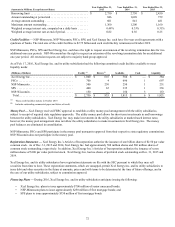
Xcel Energy Inc.’s utility subsidiaries’ wholesale and commodity trading operations measure the outstanding risk exposure to price
changes on transactions, contracts and obligations that have been entered into, but not closed, including transactions that are not
recorded at fair value, using an industry standard methodology known as Value at Risk (VaR). VaR expresses the potential change in
fair value on the outstanding transactions, contracts and obligations over a particular period of time under normal market conditions.
The VaRs for the NSP-Minnesota and PSCo commodity trading operations, calculated on a consolidated basis using a Monte Carlo
simulation with a 95 percent confidence level and a one-day holding period, were as follows:
(Millions of Dollars) Year Ended
Dec. 31 VaR Limit Average High Low
2015 . . . . . . . . . . . . . . . . . . . . . . . . . . . . . . . . . . . . . . $ 0.10 $ 3.00 $ 0.28 $ 1.34 $ 0.06
2014 . . . . . . . . . . . . . . . . . . . . . . . . . . . . . . . . . . . . . . 0.57 3.00 0.61 4.06 0.13
Nuclear Fuel Supply — NSP-Minnesota is scheduled to take delivery of approximately 46 percent of its 2016 and approximately 16
percent of its 2017 enriched nuclear material requirements from sources that could be impacted by events in Ukraine and sanctions
against Russia. Alternate potential sources are expected to provide the flexibility to manage NSP-Minnesota’s nuclear fuel supply to
ensure that plant availability and reliability will not be negatively impacted in the near-term. Long-term, through 2024, NSP-
Minnesota is scheduled to take delivery of approximately 35 percent of its average enriched nuclear material requirements from
sources that could be impacted by events in Ukraine and extended sanctions against Russia. NSP-Minnesota is closely following the
progression of these events and will periodically assess if further actions are required to assure a secure supply of enriched nuclear
material beyond 2016.
Interest Rate Risk — Xcel Energy is subject to the risk of fluctuating interest rates in the normal course of business. Xcel Energy’s
risk management policy allows interest rate risk to be managed through the use of fixed rate debt, floating rate debt and interest rate
derivatives such as swaps, caps, collars and put or call options.
At Dec. 31, 2015 and 2014, a 100 basis point change in the benchmark rate on Xcel Energy’s variable rate debt would impact annual
pretax interest expense by approximately $8.5 million and $10.4 million, respectively. See Note 11 to the consolidated financial
statements for a discussion of Xcel Energy Inc. and its subsidiaries’ interest rate derivatives.