Xcel Energy 2015 Annual Report Download - page 124
Download and view the complete annual report
Please find page 124 of the 2015 Xcel Energy annual report below. You can navigate through the pages in the report by either clicking on the pages listed below, or by using the keyword search tool below to find specific information within the annual report.-
 1
1 -
2
-
3
-
4
-
5
-
6
-
7
-
8
-
9
-
10
-
11
-
12
-
13
-
14
-
15
-
16
-
17
-
18
-
19
-
20
-
21
-
22
-
23
-
24
-
25
-
26
-
27
-
28
-
29
-
30
-
31
-
32
-
33
-
34
-
35
-
36
-
37
-
38
-
39
-
40
-
41
-
42
-
43
-
44
-
45
-
46
-
47
-
48
-
49
-
50
-
51
-
52
-
53
-
54
-
55
-
56
-
57
-
58
-
59
-
60
-
61
-
62
-
63
-
64
-
65
-
66
-
67
-
68
-
69
-
70
-
71
-
72
-
73
-
74
-
75
-
76
-
77
-
78
-
79
-
80
-
81
-
82
-
83
-
84
-
85
-
86
-
87
-
88
-
89
-
90
-
91
-
92
-
93
-
94
-
95
-
96
-
97
-
98
-
99
-
100
-
101
-
102
-
103
-
104
-
105
-
106
-
107
-
108
-
109
-
110
-
111
-
112
-
113
-
 114
114 -
 115
115 -
 116
116 -
 117
117 -
 118
118 -
 119
119 -
 120
120 -
 121
121 -
 122
122 -
 123
123 -
 124
124 -
 125
125 -
 126
126 -
 127
127 -
 128
128 -
 129
129 -
 130
130 -
 131
131 -
 132
132 -
 133
133 -
 134
134 -
135
-
136
-
137
-
138
-
139
-
140
-
141
-
142
-
143
-
144
-
145
-
146
-
147
-
148
-
149
-
150
-
151
-
152
-
153
-
154
-
155
-
156
-
157
-
158
-
159
-
160
-
161
-
162
-
163
-
164
-
165
-
166
-
167
-
168
-
169
-
170
-
171
-
172
-
173
-
174
-
175
-
176
-
177
-
178
-
179
-
180
 |
 |

106
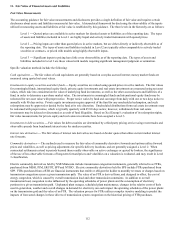
(Thousands of Dollars) Jan. 1, 2013 Net Realized
Gains (Losses) Net Unrealized
Gains (Losses)
Purchases,
Issuances and
Settlements, Net Transfers Out
of Level 3 (a) Dec. 31, 2013
Asset-backed securities . . . . . . . . . . $ 14,639 $ — $ — $ — $ (14,639) $ —
Mortgage-backed securities . . . . . . . 39,904 — — — (39,904) —
Private equity investments. . . . . . . . 158,498 22,058 (24,335)(3,372) — 152,849
Real estate . . . . . . . . . . . . . . . . . . . . 64,597 (2,659) 8,690 9,317 (32,392) 47,553
Total. . . . . . . . . . . . . . . . . . . . . . . . $ 277,638 $ 19,399 $ (15,645) $ 5,945 $ (86,935) $ 200,402
(a) Transfers out of Level 3 into Level 2 were principally due to diminished use of unobservable inputs that were previously significant to these fair value
measurements and were subsequently sold during 2013.
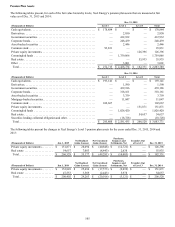
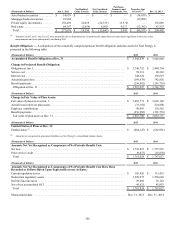
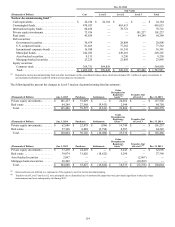
Benefit Obligations — A comparison of the actuarially computed pension benefit obligation and plan assets for Xcel Energy is
presented in the following table:
(Thousands of Dollars) 2015 2014
Accumulated Benefit Obligation at Dec. 31. . . . . . . . . . . . . . . . . . . . . . . . . . . . . . . . . . . . . . . . . . . $ 3,368,239 $ 3,545,928
Change in Projected Benefit Obligation:
Obligation at Jan. 1. . . . . . . . . . . . . . . . . . . . . . . . . . . . . . . . . . . . . . . . . . . . . . . . . . . . . . . . . . . . . . . . $ 3,746,752 $ 3,440,704
Service cost . . . . . . . . . . . . . . . . . . . . . . . . . . . . . . . . . . . . . . . . . . . . . . . . . . . . . . . . . . . . . . . . . . . . . 99,311 88,342
Interest cost . . . . . . . . . . . . . . . . . . . . . . . . . . . . . . . . . . . . . . . . . . . . . . . . . . . . . . . . . . . . . . . . . . . . . 148,524 156,619
Actuarial (gain) loss . . . . . . . . . . . . . . . . . . . . . . . . . . . . . . . . . . . . . . . . . . . . . . . . . . . . . . . . . . . . . . . (169,678) 342,826
Benefit payments . . . . . . . . . . . . . . . . . . . . . . . . . . . . . . . . . . . . . . . . . . . . . . . . . . . . . . . . . . . . . . . . . (256,982) (281,739)
Obligation at Dec. 31. . . . . . . . . . . . . . . . . . . . . . . . . . . . . . . . . . . . . . . . . . . . . . . . . . . . . . . . . . . . . $ 3,567,927 $ 3,746,752
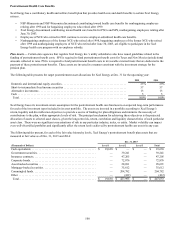
(Thousands of Dollars) 2015 2014
Change in Fair Value of Plan Assets:
Fair value of plan assets at Jan. 1. . . . . . . . . . . . . . . . . . . . . . . . . . . . . . . . . . . . . . . . . . . . . . . . . . . . . $ 3,083,771 $ 3,010,140
Actual (loss) return on plan assets . . . . . . . . . . . . . . . . . . . . . . . . . . . . . . . . . . . . . . . . . . . . . . . . . . . . (33,102) 224,808
Employer contributions . . . . . . . . . . . . . . . . . . . . . . . . . . . . . . . . . . . . . . . . . . . . . . . . . . . . . . . . . . . . 90,093 130,562
Benefit payments . . . . . . . . . . . . . . . . . . . . . . . . . . . . . . . . . . . . . . . . . . . . . . . . . . . . . . . . . . . . . . . . . (256,982) (281,739)
Fair value of plan assets at Dec. 31 . . . . . . . . . . . . . . . . . . . . . . . . . . . . . . . . . . . . . . . . . . . . . . . . . . $ 2,883,780 $ 3,083,771
(Thousands of Dollars) 2015 2014
Funded Status of Plans at Dec. 31:
Funded status (a) . . . . . . . . . . . . . . . . . . . . . . . . . . . . . . . . . . . . . . . . . . . . . . . . . . . . . . . . . . . . . . . . . . $ (684,147) $ (662,981)
(a) Amounts are recognized in noncurrent liabilities on Xcel Energy’s consolidated balance sheets.
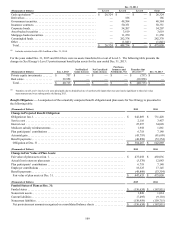
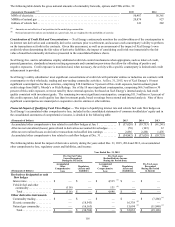
(Thousands of Dollars) 2015 2014
Amounts Not Yet Recognized as Components of Net Periodic Benefit Cost:
Net loss. . . . . . . . . . . . . . . . . . . . . . . . . . . . . . . . . . . . . . . . . . . . . . . . . . . . . . . . . . . . . . . . . . . . . . . . . $ 1,710,097 $ 1,757,935
Prior service credit . . . . . . . . . . . . . . . . . . . . . . . . . . . . . . . . . . . . . . . . . . . . . . . . . . . . . . . . . . . . . . . . (9,073) (10,878)
Total. . . . . . . . . . . . . . . . . . . . . . . . . . . . . . . . . . . . . . . . . . . . . . . . . . . . . . . . . . . . . . . . . . . . . . . . . . $ 1,701,024 $ 1,747,057
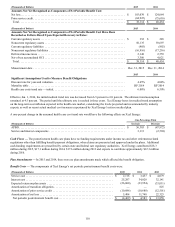
(Thousands of Dollars) 2015 2014
Amounts Not Yet Recognized as Components of Net Periodic Benefit Cost Have Been
Recorded as Follows Based Upon Expected Recovery in Rates:
Current regulatory assets . . . . . . . . . . . . . . . . . . . . . . . . . . . . . . . . . . . . . . . . . . . . . . . . . . . . . . . . . . . $ 105,426 $ 113,432
Noncurrent regulatory assets . . . . . . . . . . . . . . . . . . . . . . . . . . . . . . . . . . . . . . . . . . . . . . . . . . . . . . . . 1,520,975 1,558,649
Deferred income taxes . . . . . . . . . . . . . . . . . . . . . . . . . . . . . . . . . . . . . . . . . . . . . . . . . . . . . . . . . . . . . 29,002 29,143
Net-of-tax accumulated OCI . . . . . . . . . . . . . . . . . . . . . . . . . . . . . . . . . . . . . . . . . . . . . . . . . . . . . . . . 45,621 45,833
Total. . . . . . . . . . . . . . . . . . . . . . . . . . . . . . . . . . . . . . . . . . . . . . . . . . . . . . . . . . . . . . . . . . . . . . . . . . $ 1,701,024 $ 1,747,057
Measurement date . . . . . . . . . . . . . . . . . . . . . . . . . . . . . . . . . . . . . . . . . . . . . . . . . . . . . . . . . . . . . . . . Dec. 31, 2015 Dec. 31, 2014