Xcel Energy 2015 Annual Report Download - page 109
Download and view the complete annual report
Please find page 109 of the 2015 Xcel Energy annual report below. You can navigate through the pages in the report by either clicking on the pages listed below, or by using the keyword search tool below to find specific information within the annual report.-
 1
1 -
2
-
3
-
4
-
5
-
6
-
7
-
8
-
9
-
10
-
11
-
12
-
13
-
14
-
15
-
16
-
17
-
18
-
19
-
20
-
21
-
22
-
23
-
24
-
25
-
26
-
27
-
28
-
29
-
30
-
31
-
32
-
33
-
34
-
35
-
36
-
37
-
38
-
39
-
40
-
41
-
42
-
43
-
44
-
45
-
46
-
47
-
48
-
49
-
50
-
51
-
52
-
53
-
54
-
55
-
56
-
57
-
58
-
59
-
60
-
61
-
62
-
63
-
64
-
65
-
66
-
67
-
68
-
69
-
70
-
71
-
72
-
73
-
74
-
75
-
76
-
77
-
78
-
79
-
80
-
81
-
82
-
83
-
84
-
85
-
86
-
87
-
88
-
89
-
90
-
91
-
92
-
93
-
94
-
95
-
96
-
97
-
98
-
 99
99 -
 100
100 -
 101
101 -
 102
102 -
 103
103 -
 104
104 -
 105
105 -
 106
106 -
 107
107 -
 108
108 -
 109
109 -
 110
110 -
 111
111 -
 112
112 -
 113
113 -
 114
114 -
 115
115 -
 116
116 -
 117
117 -
 118
118 -
 119
119 -
120
-
121
-
122
-
123
-
124
-
125
-
126
-
127
-
128
-
129
-
130
-
131
-
132
-
133
-
134
-
135
-
136
-
137
-
138
-
139
-
140
-
141
-
142
-
143
-
144
-
145
-
146
-
147
-
148
-
149
-
150
-
151
-
152
-
153
-
154
-
155
-
156
-
157
-
158
-
159
-
160
-
161
-
162
-
163
-
164
-
165
-
166
-
167
-
168
-
169
-
170
-
171
-
172
-
173
-
174
-
175
-
176
-
177
-
178
-
179
-
180
 |
 |

91
Classification and Measurement of Financial Instruments — In January 2016, the FASB issued Recognition and Measurement of
Financial Assets and Financial Liabilities, Subtopic 825-10 (ASU No. 2016-01), which among other changes in accounting and
disclosure requirements, replaces the cost method of accounting for non-marketable equity securities with a model for recognizing
impairments and observable price changes, and also eliminates the available-for-sale classification for marketable equity securities.
Under the new guidance, other than when the consolidation or equity method of accounting is utilized, changes in the fair value of
equity securities are to be recognized in earnings. This guidance will be effective for interim and annual reporting periods beginning
after Dec. 15, 2017. Xcel Energy is currently evaluating the impact of adopting ASU 2016-01 on its consolidated financial statements.
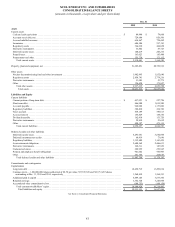
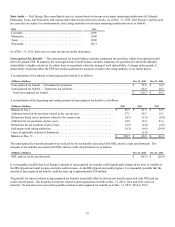
3. Selected Balance Sheet Data
(Thousands of Dollars) Dec. 31, 2015 Dec. 31, 2014
Accounts receivable, net
Accounts receivable . . . . . . . . . . . . . . . . . . . . . . . . . . . . . . . . . . . . . . . . . . . . . . . . . . . . . . . . . . $ 776,494 $ 884,225
Less allowance for bad debts . . . . . . . . . . . . . . . . . . . . . . . . . . . . . . . . . . . . . . . . . . . . . . . . . . . (51,888) (57,719)
$ 724,606 $ 826,506
(Thousands of Dollars) Dec. 31, 2015 Dec. 31, 2014
Inventories
Materials and supplies . . . . . . . . . . . . . . . . . . . . . . . . . . . . . . . . . . . . . . . . . . . . . . . . . . . . . . . . $ 290,690 $ 244,099
Fuel . . . . . . . . . . . . . . . . . . . . . . . . . . . . . . . . . . . . . . . . . . . . . . . . . . . . . . . . . . . . . . . . . . . . . . . 202,271 183,249
Natural gas . . . . . . . . . . . . . . . . . . . . . . . . . . . . . . . . . . . . . . . . . . . . . . . . . . . . . . . . . . . . . . . . . 115,623 169,835
$ 608,584 $ 597,183
(Thousands of Dollars) Dec. 31, 2015 Dec. 31, 2014
Property, plant and equipment, net
Electric plant. . . . . . . . . . . . . . . . . . . . . . . . . . . . . . . . . . . . . . . . . . . . . . . . . . . . . . . . . . . . . . . . $ 36,464,050 $ 33,203,139
Natural gas plant. . . . . . . . . . . . . . . . . . . . . . . . . . . . . . . . . . . . . . . . . . . . . . . . . . . . . . . . . . . . . 4,944,757 4,643,452
Common and other property. . . . . . . . . . . . . . . . . . . . . . . . . . . . . . . . . . . . . . . . . . . . . . . . . . . . 1,709,508 1,611,486
Plant to be retired (a) . . . . . . . . . . . . . . . . . . . . . . . . . . . . . . . . . . . . . . . . . . . . . . . . . . . . . . . . . . 38,249 71,534
CWIP . . . . . . . . . . . . . . . . . . . . . . . . . . . . . . . . . . . . . . . . . . . . . . . . . . . . . . . . . . . . . . . . . . . . . 1,256,949 2,005,531
Total property, plant and equipment . . . . . . . . . . . . . . . . . . . . . . . . . . . . . . . . . . . . . . . . . . . 44,413,513 41,535,142
Less accumulated depreciation. . . . . . . . . . . . . . . . . . . . . . . . . . . . . . . . . . . . . . . . . . . . . . . . . . (13,591,259) (13,168,418)
Nuclear fuel . . . . . . . . . . . . . . . . . . . . . . . . . . . . . . . . . . . . . . . . . . . . . . . . . . . . . . . . . . . . . . . . 2,447,251 2,347,422
Less accumulated amortization. . . . . . . . . . . . . . . . . . . . . . . . . . . . . . . . . . . . . . . . . . . . . . . . . . (2,063,654) (1,957,230)
$ 31,205,851 $ 28,756,916
(a) PSCo’s Cherokee Unit 3 was retired in August 2015. In 2017, PSCo expects to both early retire Valmont Unit 5 and convert Cherokee Unit 4 from a coal-fueled
generating facility to natural gas, as approved by the CPUC. Amounts are presented net of accumulated depreciation.
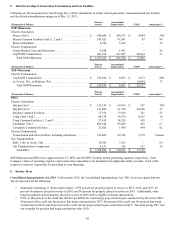
4. Borrowings and Other Financing Instruments
Short-Term Borrowings
Money Pool — Xcel Energy Inc. and its utility subsidiaries have established a money pool arrangement that allows for short-term
investments in and borrowings between the utility subsidiaries. NSP-Wisconsin does not participate in the money pool. Xcel Energy
Inc. may make investments in the utility subsidiaries at market-based interest rates; however, the money pool arrangement does not
allow the utility subsidiaries to make investments in Xcel Energy Inc. The money pool balances are eliminated in consolidation.
Commercial Paper — Xcel Energy Inc. and its utility subsidiaries meet their short-term liquidity requirements primarily through the
issuance of commercial paper and borrowings under their credit facilities. Commercial paper outstanding for Xcel Energy was as
follows:
(Amounts in Millions, Except Interest Rates) Three Months Ended
Dec. 31, 2015
Borrowing limit . . . . . . . . . . . . . . . . . . . . . . . . . . . . . . . . . . . . . . . . . . . . . . . . . . . . . . . . . . . . . . . . . . . . . . . . . . . . $ 2,750
Amount outstanding at period end. . . . . . . . . . . . . . . . . . . . . . . . . . . . . . . . . . . . . . . . . . . . . . . . . . . . . . . . . . . . . . 846
Average amount outstanding . . . . . . . . . . . . . . . . . . . . . . . . . . . . . . . . . . . . . . . . . . . . . . . . . . . . . . . . . . . . . . . . . . 290
Maximum amount outstanding . . . . . . . . . . . . . . . . . . . . . . . . . . . . . . . . . . . . . . . . . . . . . . . . . . . . . . . . . . . . . . . . 846
Weighted average interest rate, computed on a daily basis . . . . . . . . . . . . . . . . . . . . . . . . . . . . . . . . . . . . . . . . . . . 0.56%
Weighted average interest rate at period end. . . . . . . . . . . . . . . . . . . . . . . . . . . . . . . . . . . . . . . . . . . . . . . . . . . . . . 0.82