Xcel Energy 2015 Annual Report Download - page 86
Download and view the complete annual report
Please find page 86 of the 2015 Xcel Energy annual report below. You can navigate through the pages in the report by either clicking on the pages listed below, or by using the keyword search tool below to find specific information within the annual report.-
 1
1 -
2
-
3
-
4
-
5
-
6
-
7
-
8
-
9
-
10
-
11
-
12
-
13
-
14
-
15
-
16
-
17
-
18
-
19
-
20
-
21
-
22
-
23
-
24
-
25
-
26
-
27
-
28
-
29
-
30
-
31
-
32
-
33
-
34
-
35
-
36
-
37
-
38
-
39
-
40
-
41
-
42
-
43
-
44
-
45
-
46
-
47
-
48
-
49
-
50
-
51
-
52
-
53
-
54
-
55
-
56
-
57
-
58
-
59
-
60
-
61
-
62
-
63
-
64
-
65
-
66
-
67
-
68
-
69
-
70
-
71
-
72
-
73
-
74
-
75
-
 76
76 -
 77
77 -
 78
78 -
 79
79 -
 80
80 -
 81
81 -
 82
82 -
 83
83 -
 84
84 -
 85
85 -
 86
86 -
 87
87 -
 88
88 -
 89
89 -
 90
90 -
 91
91 -
 92
92 -
 93
93 -
 94
94 -
 95
95 -
 96
96 -
97
-
98
-
99
-
100
-
101
-
102
-
103
-
104
-
105
-
106
-
107
-
108
-
109
-
110
-
111
-
112
-
113
-
114
-
115
-
116
-
117
-
118
-
119
-
120
-
121
-
122
-
123
-
124
-
125
-
126
-
127
-
128
-
129
-
130
-
131
-
132
-
133
-
134
-
135
-
136
-
137
-
138
-
139
-
140
-
141
-
142
-
143
-
144
-
145
-
146
-
147
-
148
-
149
-
150
-
151
-
152
-
153
-
154
-
155
-
156
-
157
-
158
-
159
-
160
-
161
-
162
-
163
-
164
-
165
-
166
-
167
-
168
-
169
-
170
-
171
-
172
-
173
-
174
-
175
-
176
-
177
-
178
-
179
-
180
 |
 |

68
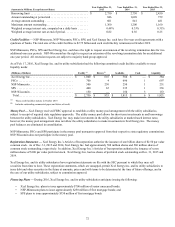
Nuclear Decommissioning Fund — Nuclear decommissioning fund assets assigned to Level 3 consist of private equity investments
and real estate investments. Based on an evaluation of NSP-Minnesota’s ability to redeem private equity investments and real estate
investment funds measured at net asset value, estimated fair values for these investments totaling $242.3 million in the nuclear
decommissioning fund at Dec. 31, 2015 (approximately 13.6 percent of total assets measured at fair value) are assigned to Level 3.
Realized and unrealized gains and losses on nuclear decommissioning fund investments are deferred as a regulatory asset.
Liquidity and Capital Resources
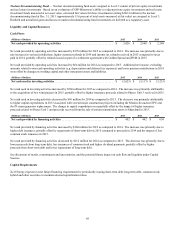
Cash Flows
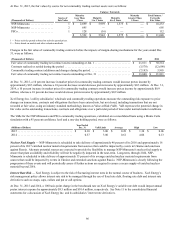
(Millions of Dollars) 2015 2014 2013
Net cash provided by operating activities . . . . . . . . . . . . . . . . . . . . . . . . . . . . . . . . . . . . $ 3,026 $ 2,648 $ 2,584
Net cash provided by operating activities increased by $378 million for 2015 as compared to 2014. The increase was primarily due to
rate increases in various jurisdictions, higher customer refunds in 2014 and income tax refunds received in 2015 compared to taxes
paid in 2014, partially offset by refunds issued as part of a settlement agreement with Golden Spread and PNM in 2015.
Net cash provided by operating activities increased by $64 million for 2014 as compared to 2013. Additional net income, excluding
amounts related to non-cash operating activities (e.g. depreciation and deferred tax expenses) and lower pension contributions in 2014
were offset by changes in working capital and other noncurrent assets and liabilities.
(Millions of Dollars) 2015 2014 2013
Net cash used in investing activities . . . . . . . . . . . . . . . . . . . . . . . . . . . . . . . . . . . . . . . . . $ (3,623) $ (3,117) $ (3,213)
Net cash used in investing activities increased by $506 million for 2015 as compared to 2014. The increase was primarily attributable
to the acquisition of two wind projects in 2015, partially offset by higher insurance proceeds related to Sherco Unit 3 received in 2015.
Net cash used in investing activities decreased by $96 million for 2014 as compared to 2013. The decrease was primarily attributable
to higher capital expenditures in 2013 associated with several major construction projects including the Monticello nuclear EPU and
the PI steam generator replacement. The change in capital expenditures was partially offset by the impact of higher insurance
proceeds related to Sherco Unit 3 and proceeds received from the sale of certain transmission assets to Sharyland in 2013.
(Millions of Dollars) 2015 2014 2013
Net cash provided by financing activities . . . . . . . . . . . . . . . . . . . . . . . . . . . . . . . . . . . . $ 602 $ 442 $ 654
Net cash provided by financing activities increased by $160 million for 2015 as compared to 2014. The increase was primarily due to
higher debt issuances, partially offset by repayments of short-term debt in 2015 compared to proceeds in 2014 and the impact of less
common stock issuances in 2015.
Net cash provided by financing activities decreased by $212 million for 2014 as compared to 2013. The decrease was primarily due to
lower proceeds from long-term debt, less issuances of common stock and higher dividend payments, partially offset by higher
proceeds from short-term debt and lower repayments of long-term debt.
See discussion of trends, commitments and uncertainties, and the potential future impact on cash flow and liquidity under Capital
Sources.
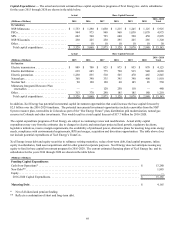
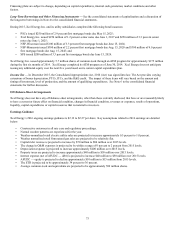
Capital Requirements
Xcel Energy expects to meet future financing requirements by periodically issuing short-term debt, long-term debt, common stock,
hybrid and other securities to maintain desired capitalization ratios.