Xcel Energy 2015 Annual Report Download - page 71
Download and view the complete annual report
Please find page 71 of the 2015 Xcel Energy annual report below. You can navigate through the pages in the report by either clicking on the pages listed below, or by using the keyword search tool below to find specific information within the annual report.-
 1
1 -
2
-
3
-
4
-
5
-
6
-
7
-
8
-
9
-
10
-
11
-
12
-
13
-
14
-
15
-
16
-
17
-
18
-
19
-
20
-
21
-
22
-
23
-
24
-
25
-
26
-
27
-
28
-
29
-
30
-
31
-
32
-
33
-
34
-
35
-
36
-
37
-
38
-
39
-
40
-
41
-
42
-
43
-
44
-
45
-
46
-
47
-
48
-
49
-
50
-
51
-
52
-
53
-
54
-
55
-
56
-
57
-
58
-
59
-
60
-
 61
61 -
 62
62 -
 63
63 -
 64
64 -
 65
65 -
 66
66 -
 67
67 -
 68
68 -
 69
69 -
 70
70 -
 71
71 -
 72
72 -
 73
73 -
 74
74 -
 75
75 -
 76
76 -
 77
77 -
 78
78 -
 79
79 -
 80
80 -
 81
81 -
82
-
83
-
84
-
85
-
86
-
87
-
88
-
89
-
90
-
91
-
92
-
93
-
94
-
95
-
96
-
97
-
98
-
99
-
100
-
101
-
102
-
103
-
104
-
105
-
106
-
107
-
108
-
109
-
110
-
111
-
112
-
113
-
114
-
115
-
116
-
117
-
118
-
119
-
120
-
121
-
122
-
123
-
124
-
125
-
126
-
127
-
128
-
129
-
130
-
131
-
132
-
133
-
134
-
135
-
136
-
137
-
138
-
139
-
140
-
141
-
142
-
143
-
144
-
145
-
146
-
147
-
148
-
149
-
150
-
151
-
152
-
153
-
154
-
155
-
156
-
157
-
158
-
159
-
160
-
161
-
162
-
163
-
164
-
165
-
166
-
167
-
168
-
169
-
170
-
171
-
172
-
173
-
174
-
175
-
176
-
177
-
178
-
179
-
180
 |
 |

53
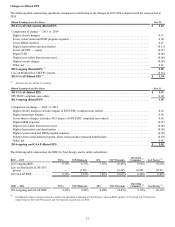
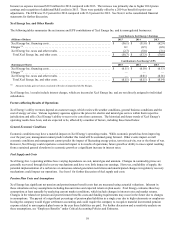
The percentage increase (decrease) in normal and actual HDD, CDD and THI are provided in the following table:
2015 vs.
Normal 2014 vs.
Normal 2015 vs.
2014 2013 vs.
Normal 2014 vs.
2013
HDD . . . . . . . . . . . . . . . . . . . . . . . . . . . . . . . . . . . . . . . . . . . (7.9)% 7.8% (14.8)% 6.5% 0.4%
CDD . . . . . . . . . . . . . . . . . . . . . . . . . . . . . . . . . . . . . . . . . . . 6.2 (2.6) 10.3 24.7 (20.3)
THI . . . . . . . . . . . . . . . . . . . . . . . . . . . . . . . . . . . . . . . . . . . . (2.3) (11.9) 14.1 21.8 (24.2)
Weather — The following table summarizes the estimated impact of temperature variations on EPS compared with sales under normal
weather conditions:
2015 vs.
Normal 2014 vs.
Normal 2015 vs.
2014 2013 vs.
Normal 2014 vs.
2013
Retail electric . . . . . . . . . . . . . . . . . . . . . . . . . . . . . . . . . . . . $ (0.020) $ 0.010 $ (0.030) $ 0.088 $ (0.078)
Firm natural gas . . . . . . . . . . . . . . . . . . . . . . . . . . . . . . . . . . (0.018) 0.019 (0.037) 0.021 (0.002)
Total . . . . . . . . . . . . . . . . . . . . . . . . . . . . . . . . . . . . . . . . . . $ (0.038) $ 0.029 $ (0.067) $ 0.109 $ (0.080)
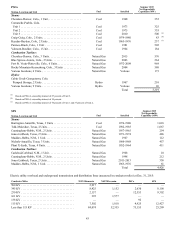
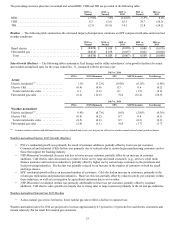
Sales Growth (Decline) — The following tables summarize Xcel Energy and its utility subsidiaries’ sales growth (decline) for actual
and weather-normalized sales for the years ended Dec. 31, compared with the previous year:
2015 vs. 2014
PSCo NSP-Minnesota SPS NSP-Wisconsin Xcel Energy
Actual
Electric residential (a) . . . . . . . . . . . . . . . . . . . 1.1% (3.2)% (0.4)% (6.1)% (1.4)%
Electric C&I. . . . . . . . . . . . . . . . . . . . . . . . . . (0.4) (0.6) 0.3 0.4 (0.2)
Total retail electric sales . . . . . . . . . . . . . . . 0.1 (1.4) 0.1 (1.5) (0.6)
Firm natural gas sales . . . . . . . . . . . . . . . . . . (6.6) (16.6) N/A (16.4) (10.5)
2015 vs. 2014
PSCo NSP-Minnesota SPS NSP-Wisconsin Xcel Energy
Weather-normalized
Electric residential (a) . . . . . . . . . . . . . . . . . . . 0.4% (0.7)% 0.6% (2.8)% (0.3)%
Electric C&I. . . . . . . . . . . . . . . . . . . . . . . . . . (0.9) (0.2) 0.7 0.8 (0.1)
Total retail electric sales . . . . . . . . . . . . . . . (0.5) (0.4) 0.5 (0.3) (0.2)
Firm natural gas sales . . . . . . . . . . . . . . . . . . (2.0) (1.1) N/A (1.7) (1.7)
(a) Extreme weather variations and additional factors such as windchill and cloud cover may not be reflected in weather-normalized and actual growth estimates.
Weather-normalized Electric 2015 Growth (Decline)
• PSCo’s residential growth was primarily the result of customer additions, partially offset by lower use per customer.
Commercial and industrial (C&I) decline was primarily due to reduced sales to certain large manufacturing customers and/or
those that support the fracking industry.
• NSP-Minnesota’s residential decrease was due to lower use per customer, partially offset by an increase in customer
additions. C&I electric sales decreased as a result of lower use by large and small customers (e.g., services, retail trade,
finance insurance and real estate industries), partially offset by higher use by certain large customers in the petroleum and
food processing industries. The decline was partially reduced by an increase in the number of customers in both the small
and large classes.
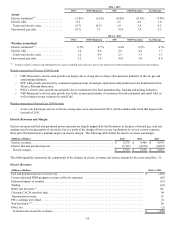
• SPS’ residential growth reflects an increased number of customers. C&I also had an increase in customers, primarily in the
oil and gas exploration and production industries. However, this was partially offset by reduced activity per customer within
these industries, as well as less irrigation by agricultural customers due to wet weather.
• NSP-Wisconsin’s residential decline was primarily attributable to lower use per customer, partially offset by customer
additions. C&I electric sales growth was largely due to strong sales to large customers primarily in the oil and gas industries.
Weather-normalized Natural Gas 2015 Decline
• Across natural gas service territories, lower natural gas sales reflect a decline in customer use.
Weather-normalized sales for 2016 are projected to increase approximately 0.5 percent to 1.0 percent for retail electric customers and
remain relatively flat for retail firm natural gas customers.