Xcel Energy 2015 Annual Report Download - page 126
Download and view the complete annual report
Please find page 126 of the 2015 Xcel Energy annual report below. You can navigate through the pages in the report by either clicking on the pages listed below, or by using the keyword search tool below to find specific information within the annual report.-
 1
1 -
2
-
3
-
4
-
5
-
6
-
7
-
8
-
9
-
10
-
11
-
12
-
13
-
14
-
15
-
16
-
17
-
18
-
19
-
20
-
21
-
22
-
23
-
24
-
25
-
26
-
27
-
28
-
29
-
30
-
31
-
32
-
33
-
34
-
35
-
36
-
37
-
38
-
39
-
40
-
41
-
42
-
43
-
44
-
45
-
46
-
47
-
48
-
49
-
50
-
51
-
52
-
53
-
54
-
55
-
56
-
57
-
58
-
59
-
60
-
61
-
62
-
63
-
64
-
65
-
66
-
67
-
68
-
69
-
70
-
71
-
72
-
73
-
74
-
75
-
76
-
77
-
78
-
79
-
80
-
81
-
82
-
83
-
84
-
85
-
86
-
87
-
88
-
89
-
90
-
91
-
92
-
93
-
94
-
95
-
96
-
97
-
98
-
99
-
100
-
101
-
102
-
103
-
104
-
105
-
106
-
107
-
108
-
109
-
110
-
111
-
112
-
113
-
114
-
115
-
 116
116 -
 117
117 -
 118
118 -
 119
119 -
 120
120 -
 121
121 -
 122
122 -
 123
123 -
 124
124 -
 125
125 -
 126
126 -
 127
127 -
 128
128 -
 129
129 -
 130
130 -
 131
131 -
 132
132 -
 133
133 -
 134
134 -
 135
135 -
 136
136 -
137
-
138
-
139
-
140
-
141
-
142
-
143
-
144
-
145
-
146
-
147
-
148
-
149
-
150
-
151
-
152
-
153
-
154
-
155
-
156
-
157
-
158
-
159
-
160
-
161
-
162
-
163
-
164
-
165
-
166
-
167
-
168
-
169
-
170
-
171
-
172
-
173
-
174
-
175
-
176
-
177
-
178
-
179
-
180
 |
 |

108
Postretirement Health Care Benefits
Xcel Energy has a contributory health and welfare benefit plan that provides health care and death benefits to certain Xcel Energy
retirees.
• NSP-Minnesota and NSP-Wisconsin discontinued contributing toward health care benefits for nonbargaining employees
retiring after 1998 and for bargaining employees who retired after 1999.
• Xcel Energy discontinued contributing toward health care benefits for PSCo and SPS, nonbargaining employees retiring after
June 30, 2003.
• Employees of NCE who retired in 2002 continue to receive employer-subsidized health care benefits.
• Nonbargaining employees of the former NCE who retired after 1998, bargaining employees of the former NCE who retired
after 1999 and nonbargaining employees of NCE who retired after June 30, 2003, are eligible to participate in the Xcel
Energy health care program with no employer subsidy.
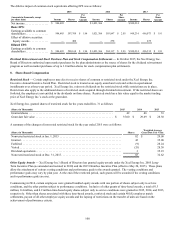
Plan Assets — Certain state agencies that regulate Xcel Energy Inc.’s utility subsidiaries also have issued guidelines related to the
funding of postretirement benefit costs. SPS is required to fund postretirement benefit costs for Texas and New Mexico jurisdictional
amounts collected in rates. PSCo is required to fund postretirement benefit costs in irrevocable external trusts that are dedicated to the
payment of these postretirement benefits. These assets are invested in a manner consistent with the investment strategy for the
pension plan.
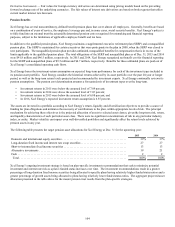
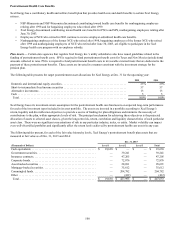
The following table presents the target postretirement asset allocations for Xcel Energy at Dec. 31 for the upcoming year:
2015 2014
Domestic and international equity securities . . . . . . . . . . . . . . . . . . . . . . . . . . . . . . . . . . . . . . . . . . . . . 25% 25%
Short-to-intermediate fixed income securities . . . . . . . . . . . . . . . . . . . . . . . . . . . . . . . . . . . . . . . . . . . . 57 57
Alternative investments . . . . . . . . . . . . . . . . . . . . . . . . . . . . . . . . . . . . . . . . . . . . . . . . . . . . . . . . . . . . . 13 13
Cash . . . . . . . . . . . . . . . . . . . . . . . . . . . . . . . . . . . . . . . . . . . . . . . . . . . . . . . . . . . . . . . . . . . . . . . . . . . . 5 5
Total . . . . . . . . . . . . . . . . . . . . . . . . . . . . . . . . . . . . . . . . . . . . . . . . . . . . . . . . . . . . . . . . . . . . . . . . . . . 100% 100%
Xcel Energy bases its investment-return assumption for the postretirement health care fund assets on expected long-term performance
for each of the investment types included in its asset portfolio. The assets are invested in a portfolio according to Xcel Energy’s
return, liquidity and diversification objectives to provide a source of funding for plan obligations and minimize the necessity of
contributions to the plan, within appropriate levels of risk. The principal mechanism for achieving these objectives is the projected
allocation of assets to selected asset classes, given the long-term risk, return, correlation and liquidity characteristics of each particular
asset class. There were no significant concentrations of risk in any particular industry, index, or entity. Market volatility can impact
even well-diversified portfolios and significantly affect the return levels achieved by postretirement health care assets in any year.
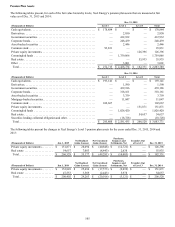
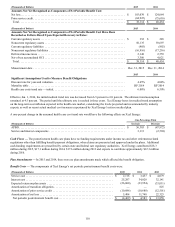
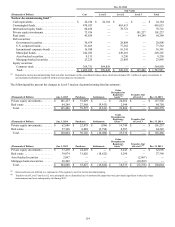
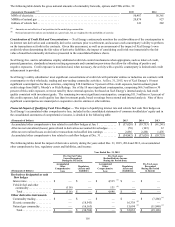
The following tables present, for each of the fair value hierarchy levels, Xcel Energy’s postretirement benefit plan assets that are
measured at fair value as of Dec. 31, 2015 and 2014:
Dec. 31, 2015
(Thousands of Dollars) Level 1 Level 2 Level 3 Total
Cash equivalents . . . . . . . . . . . . . . . . . . . . . . . . . . . . . . . . . . . . . . . . . . . . . $ 19,638 $ — $ — $ 19,638
Government securities . . . . . . . . . . . . . . . . . . . . . . . . . . . . . . . . . . . . . . . . . — 39,241 — 39,241
Insurance contracts. . . . . . . . . . . . . . . . . . . . . . . . . . . . . . . . . . . . . . . . . . . . — 47,205 — 47,205
Corporate bonds. . . . . . . . . . . . . . . . . . . . . . . . . . . . . . . . . . . . . . . . . . . . . . — 72,876 — 72,876
Asset-backed securities . . . . . . . . . . . . . . . . . . . . . . . . . . . . . . . . . . . . . . . . — 28,691 — 28,691
Mortgage-backed securities . . . . . . . . . . . . . . . . . . . . . . . . . . . . . . . . . . . . . — 35,612 — 35,612
Commingled funds. . . . . . . . . . . . . . . . . . . . . . . . . . . . . . . . . . . . . . . . . . . . — 204,782 — 204,782
Other . . . . . . . . . . . . . . . . . . . . . . . . . . . . . . . . . . . . . . . . . . . . . . . . . . . . . . — (412) — (412)
Total. . . . . . . . . . . . . . . . . . . . . . . . . . . . . . . . . . . . . . . . . . . . . . . . . . . . . . $ 19,638 $ 427,995 $ — $ 447,633