Xcel Energy 2015 Annual Report Download - page 44
Download and view the complete annual report
Please find page 44 of the 2015 Xcel Energy annual report below. You can navigate through the pages in the report by either clicking on the pages listed below, or by using the keyword search tool below to find specific information within the annual report.-
 1
1 -
2
-
3
-
4
-
5
-
6
-
7
-
8
-
9
-
10
-
11
-
12
-
13
-
14
-
15
-
16
-
17
-
18
-
19
-
20
-
21
-
22
-
23
-
24
-
25
-
26
-
27
-
28
-
29
-
30
-
31
-
32
-
33
-
 34
34 -
 35
35 -
 36
36 -
 37
37 -
 38
38 -
 39
39 -
 40
40 -
 41
41 -
 42
42 -
 43
43 -
 44
44 -
 45
45 -
 46
46 -
 47
47 -
 48
48 -
 49
49 -
 50
50 -
 51
51 -
 52
52 -
 53
53 -
 54
54 -
55
-
56
-
57
-
58
-
59
-
60
-
61
-
62
-
63
-
64
-
65
-
66
-
67
-
68
-
69
-
70
-
71
-
72
-
73
-
74
-
75
-
76
-
77
-
78
-
79
-
80
-
81
-
82
-
83
-
84
-
85
-
86
-
87
-
88
-
89
-
90
-
91
-
92
-
93
-
94
-
95
-
96
-
97
-
98
-
99
-
100
-
101
-
102
-
103
-
104
-
105
-
106
-
107
-
108
-
109
-
110
-
111
-
112
-
113
-
114
-
115
-
116
-
117
-
118
-
119
-
120
-
121
-
122
-
123
-
124
-
125
-
126
-
127
-
128
-
129
-
130
-
131
-
132
-
133
-
134
-
135
-
136
-
137
-
138
-
139
-
140
-
141
-
142
-
143
-
144
-
145
-
146
-
147
-
148
-
149
-
150
-
151
-
152
-
153
-
154
-
155
-
156
-
157
-
158
-
159
-
160
-
161
-
162
-
163
-
164
-
165
-
166
-
167
-
168
-
169
-
170
-
171
-
172
-
173
-
174
-
175
-
176
-
177
-
178
-
179
-
180
 |
 |

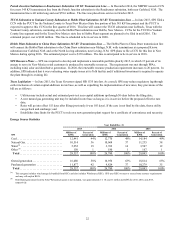
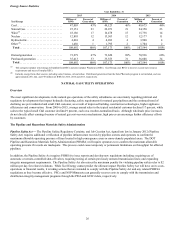
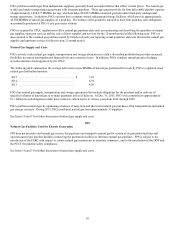
26
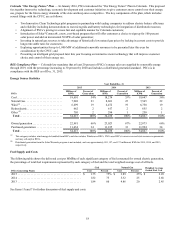
Energy Source Statistics
Year Ended Dec. 31
2015 2014 2013
Xcel Energy Millions of
KWh Percent of
Generation Millions of
KWh Percent of
Generation Millions of
KWh Percent of
Generation
Coal. . . . . . . . . . . . . . . . . . . . . . . . . . . . . . . . 47,003 43% 49,123 46% 49,675 46%
Natural Gas . . . . . . . . . . . . . . . . . . . . . . . . . . 25,151 23 22,071 21 24,350 23
Wind (a) . . . . . . . . . . . . . . . . . . . . . . . . . . . . . 18,186 17 16,478 15 15,738 14
Nuclear . . . . . . . . . . . . . . . . . . . . . . . . . . . . . 12,895 12 13,503 12 12,177 11
Hydroelectric. . . . . . . . . . . . . . . . . . . . . . . . . 4,001 4 4,203 4 3,900 4
Other (b) . . . . . . . . . . . . . . . . . . . . . . . . . . . . . 1,456 1 1,795 2 1,704 2
Total . . . . . . . . . . . . . . . . . . . . . . . . . . . . . . 108,692 100% 107,173 100% 107,544 100%
Owned generation . . . . . . . . . . . . . . . . . . . . . 73,279 67% 73,620 69% 70,936 66%
Purchased generation . . . . . . . . . . . . . . . . . . 35,413 33 33,553 31 36,608 34
Total . . . . . . . . . . . . . . . . . . . . . . . . . . . . . . 108,692 100% 107,173 100% 107,544 100%
(a) This category includes wind energy de-bundled from RECs and also includes Windsource RECs. Xcel Energy uses RECs to meet or exceed state resource
requirements and may sell surplus RECs.
(b) Includes energy from other sources, including solar, biomass, oil and refuse. Distributed generation from the Solar*Rewards program is not included, and was
approximately 266, 222, and 198 million net KWh for 2015, 2014 and 2013, respectively.
NATURAL GAS UTILITY OPERATIONS
Overview
The most significant developments in the natural gas operations of the utility subsidiaries are uncertainty regarding political and
regulatory developments that impact hydraulic fracturing, safety requirements for natural gas pipelines and the continued trend of
declining use per residential and small C&I customer, as a result of improved building construction technologies, higher appliance
efficiencies and conservation. From 2000 to 2015, average annual sales to the typical residential customer declined 17 percent, while
sales to the typical small C&I customer declined 9 percent, each on a weather-normalized basis. Although wholesale price increases
do not directly affect earnings because of natural gas cost-recovery mechanisms, high prices can encourage further efficiency efforts
by customers.
The Pipeline and Hazardous Materials Safety Administration
Pipeline Safety Act — The Pipeline Safety, Regulatory Certainty, and Job Creation Act, signed into law in January 2012 (Pipeline
Safety Act) requires additional verification of pipeline infrastructure records by pipeline owners and operators to confirm the
maximum allowable operating pressure of lines located in high consequence areas or more-densely populated areas. The DOT
Pipeline and Hazardous Materials Safety Administration (PHMSA) will require operators to re-confirm the maximum allowable
operating pressure if records are inadequate. This process could cause temporary or permanent limitations on throughput for affected
pipelines.
In addition, the Pipeline Safety Act requires PHMSA to issue reports and develop new regulations including: requiring use of
automatic or remote-controlled shut-off valves; requiring testing of certain previously untested transmission lines; and expanding
integrity management requirements. The Pipeline Safety Act also raises the maximum penalty for violating pipeline safety rules to $2
million per day for related violations. While Xcel Energy cannot predict the ultimate impact Pipeline Safety Act will have on its costs,
operations or financial results, it is taking actions that are intended to comply with the Pipeline Safety Act and any related PHMSA
regulations as they become effective. PSCo and NSP-Minnesota can generally recover costs to comply with the transmission and
distribution integrity management programs through the PSIA and GUIC riders, respectively.