Whirlpool 2011 Annual Report Download - page 7
Download and view the complete annual report
Please find page 7 of the 2011 Whirlpool annual report below. You can navigate through the pages in the report by either clicking on the pages listed below, or by using the keyword search tool below to find specific information within the annual report.-
 1
1 -
 2
2 -
 3
3 -
 4
4 -
 5
5 -
 6
6 -
 7
7 -
 8
8 -
 9
9 -
 10
10 -
 11
11 -
 12
12 -
 13
13 -
 14
14 -
 15
15 -
 16
16 -
 17
17 -
 18
18 -
19
-
20
-
21
-
22
-
23
-
24
-
25
-
26
-
27
-
28
-
29
-
30
-
31
-
32
-
33
-
34
-
35
-
36
-
37
-
38
-
39
-
40
-
41
-
42
-
43
-
44
-
45
-
46
-
47
-
48
-
49
-
50
-
51
-
52
-
53
-
54
 |
 |
5
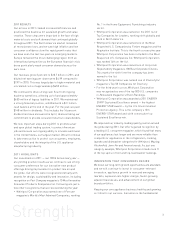
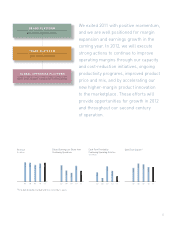
We exited 2011 with positive momentum,
and we are well positioned for margin
expansion and earnings growth in the
coming year. In 2012, we will execute
strong actions to continue to improve
operating margins through our capacity
and cost-reduction initiatives, ongoing
productivity programs, improved product
price and mix, and by accelerating our
new higher-margin product innovation
to the marketplace. These efforts will
provide opportunities for growth in 2012
and throughout our second century
of operation.
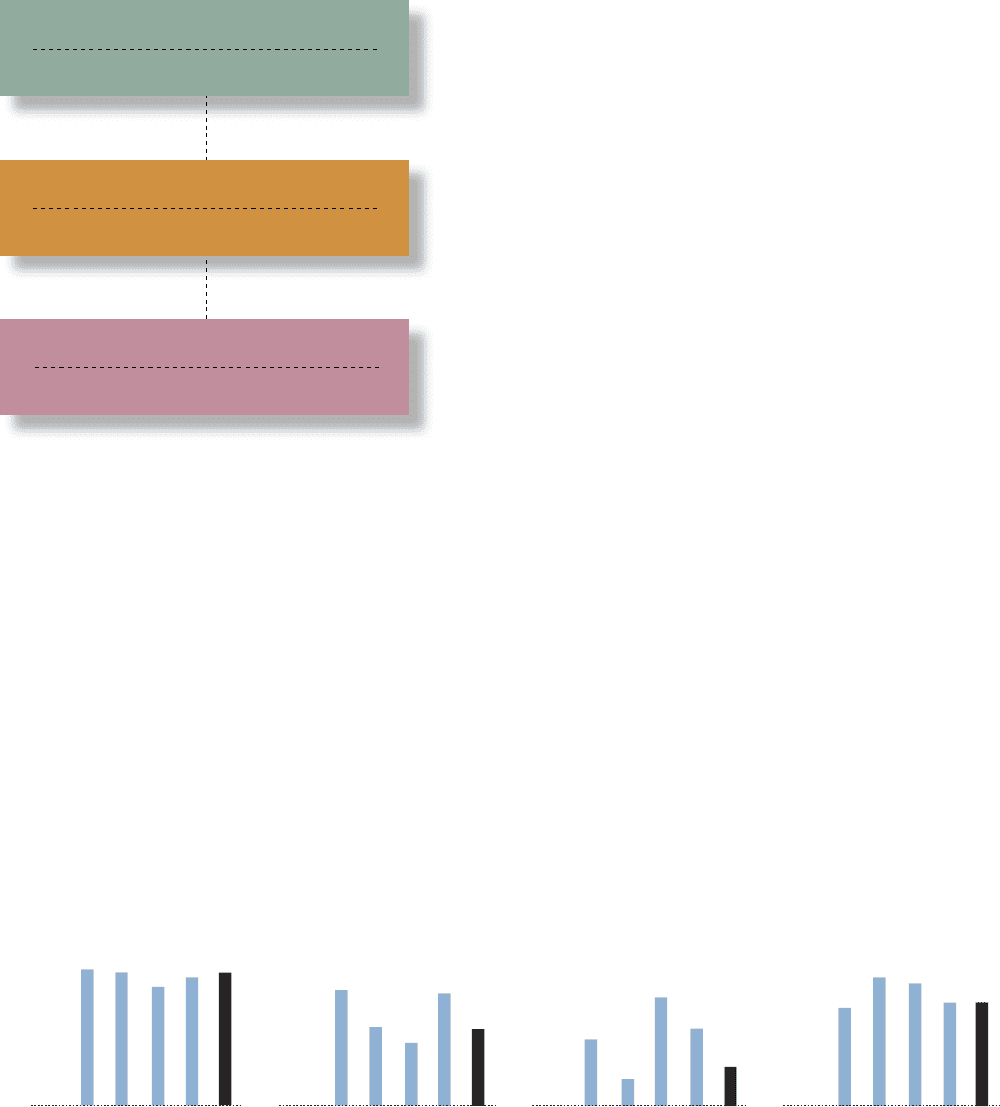
Revenue
$ in millions
’07 ’08 ’09 ’10 ’11
Cash Flow Provided by
Continuing Operating Activities
’07 ’08 ’09 ’10 ’11
Diluted Earnings per Share from
Continuing Operations
’07 ’08 ’09 ’10 ’11
Debt/Total Capital
’07 ’08 ’09 ’10 ’11
$ in billions
$19.4
$18.9
$17.1
$927
$327
$1,550
34.5%
46.0%
43.6%
$8.10
$5.50
$4.34
$1,078
36.7%
(1)
$18.4
$7.97
$18.7
$4.99
$530
36.8%
(1)Total debt divided by total debt and total stockholders’ equity.
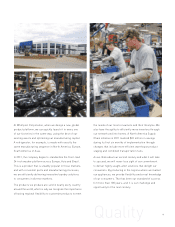
GLOBAL OPERATING PLATFORM
BEST COST, QUALITY AND ASSET UTILIZATION
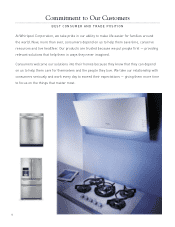
TRADE PLATFORM
BEST TRADE POSITION
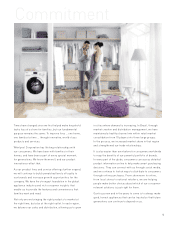
BRAND PLATFORM
BEST CONSUMER POSITION