Whirlpool 2011 Annual Report Download - page 38
Download and view the complete annual report
Please find page 38 of the 2011 Whirlpool annual report below. You can navigate through the pages in the report by either clicking on the pages listed below, or by using the keyword search tool below to find specific information within the annual report.-
 1
1 -
2
-
3
-
4
-
5
-
6
-
7
-
8
-
9
-
10
-
11
-
12
-
13
-
14
-
15
-
16
-
17
-
18
-
19
-
20
-
21
-
22
-
23
-
24
-
25
-
26
-
27
-
 28
28 -
 29
29 -
 30
30 -
 31
31 -
 32
32 -
 33
33 -
 34
34 -
 35
35 -
 36
36 -
 37
37 -
 38
38 -
 39
39 -
 40
40 -
 41
41 -
 42
42 -
 43
43 -
 44
44 -
 45
45 -
 46
46 -
 47
47 -
 48
48 -
49
-
50
-
51
-
52
-
53
-
54
 |
 |
36
Whirlpool’s ongoing focus on cost reductions, productivity
improvements and investment in innovative new products
continue to enable Whirlpool to adapt to changes in the
macroeconomic environment and maintain our position as
the global number one home appliance maker.
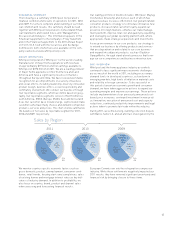
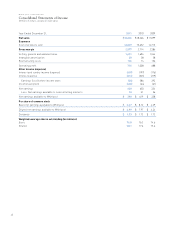
Consolidated Net Sales
Consolidated net sales increased 1.6% compared to 2010
primarily due to the favorable impact of foreign currency
and higher BEFIEX credits recognized, partially offset by
lower unit shipments. Excluding the impact of foreign cur-
rency, consolidated net sales decreased 0.4% compared
to 2010. Consolidated net sales for 2010 increased 7.4%
compared to 2009 primarily due to higher unit shipments,
higher BEFIEX credits recognized and the favorable impact
of foreign currency, partially offset by unfavorable product
price/mix. Excluding the impact of foreign currency, consol-
idated net sales for 2010 increased 5.3% compared to 2009.
Significant regional trends were as follows:
• North America net sales decreased 2.1% compared to
2010 primarily due to a 2.0% decrease in units sold.
Improvements in product price/mix were experienced
during the second half of 2011 as we began to realize
the effects of pricing actions taken earlier in the year.
However, for the full year, net sales were slightly unfa-
vorable to 2010 as a result of product price/mix. Foreign
currency did not have a significant impact on North
America net sales in 2011. North America net sales for
2010 increased 2.0% compared to 2009 primarily due to
a 5.9% increase in units sold. The increase in units sold
was driven by strong industry growth in the first half
which slowed significantly in the second half primarily in
the United States. In addition, net sales were negatively
impacted by unfavorable product price/mix, including
pricing actions during the second half of 2010 taken to
match aggressive competitive pricing pressure, partially
offset by the favorable impact of foreign currency. Exclud-
ing the impact of foreign currency, North America net
sales increased 0.7% in 2010.
• Latin America net sales increased 7.8% compared to
2010 primarily due to the favorable impact of foreign
currency, improved product price/mix, higher BEFIEX
credits recognized and a 1.4% increase in units sold.
Excluding the impact of foreign currency and higher
BEFIEX credits, Latin America net sales increased 3.0%
in 2011. Latin America net sales for 2010 increased 26.7%
compared to 2009 primarily due to a 16.1% increase
in units sold. The increase in units sold was driven by
strong industry growth in the first half which moderated
somewhat in the second half of the year. In addition, net
sales increased due to the favorable impact of foreign
currency and higher BEFIEX credits recognized, partially
offset by unfavorable product price/mix. Excluding the
impact of foreign currency and higher BEFIEX credits,
Latin America net sales increased 13.7% in 2010.
In previous years, our Brazilian operations earned tax
credits under the Brazilian government’s export incentive
program (BEFIEX). These credits reduce Brazilian federal
excise taxes on domestic sales, resulting in an increase
in the operations’ recorded net sales. After a favorable
court decision in 2005, upheld by a December 2011 appel-
late court decision, we were able to recognize approxi-
mately $266 million, $225 million, and $69 million of
export credits during 2011, 2010 and 2009, respectively.
Export credits recognized are not subject to income
taxes. We recognize exports credits as they are monetized;
however, future actions by the Brazilian government
could limit our ability to monetize these export credits.
The Brazilian government announced an Impostos
sobre Produtos (“IPI”) sales tax holiday on appliances in
December 2011, which expires on March 31, 2012. During
this holiday, we expect to monetize reduced amounts of
export credits because the export credits are monetized
through the offset of IPI taxes due. As of December 31,
2011, approximately $238 million of future cash moneti-
zation remained, including $60 million of related court
awarded fees, which will be payable in subsequent years.
A Brazilian law change to the inflation index tables
reduced available cash monetization by $62 million
in 2011.
• EMEA net sales increased 2.4% compared to 2010, pri-
marily due to the favorable impact of foreign currency,
partially offset by unfavorable product price/mix. Exclud-
ing the impact of foreign currency, net sales decreased
3.1%. EMEA net sales for 2010 decreased 3.3% compared
to 2009, primarily due to the unfavorable impact of foreign
currency and unfavorable product price/mix driven by an
increasingly competitive pricing environment, partially
offset by a 4.7% increase in units sold due to higher
industry demand which accelerated during the second
half of 2010. Excluding the impact of foreign currency,
net sales increased 0.7% in 2010.
• Asia net sales increased 3.1% compared to 2010 primarily
due to improved product price/mix, the favorable impact
of foreign currency and a 0.5% increase in units sold.
Excluding the impact of foreign currency, Asia net sales
increased 2.3%. Asia net sales for 2010 increased 30.6%,
led by results in India and China, compared to 2009 pri-
marily due to a 22.4% increase in units sold. Excluding
the impact of foreign currency, Asia net sales increased
23.8% in 2010.
Gross Margin
The consolidated gross margin percentage decreased 1.0
points to 13.8% compared to 2010, primarily due to material
cost increases, partially offset by productivity improvements
and higher BEFIEX credits recognized. In addition, gross
margin benefited from the net impacts of a supplier recov-
ery payment received in 2011, charges related to a product
recall in 2010 that did not recur in 2011, partially offset by
lower curtailment gains in a postretirement healthcare plan
during 2011.