Whirlpool 2011 Annual Report Download - page 39
Download and view the complete annual report
Please find page 39 of the 2011 Whirlpool annual report below. You can navigate through the pages in the report by either clicking on the pages listed below, or by using the keyword search tool below to find specific information within the annual report.-
 1
1 -
2
-
3
-
4
-
5
-
6
-
7
-
8
-
9
-
10
-
11
-
12
-
13
-
14
-
15
-
16
-
17
-
18
-
19
-
20
-
21
-
22
-
23
-
24
-
25
-
26
-
27
-
28
-
 29
29 -
 30
30 -
 31
31 -
 32
32 -
 33
33 -
 34
34 -
 35
35 -
 36
36 -
 37
37 -
 38
38 -
 39
39 -
 40
40 -
 41
41 -
 42
42 -
 43
43 -
 44
44 -
 45
45 -
 46
46 -
 47
47 -
 48
48 -
 49
49 -
50
-
51
-
52
-
53
-
54
 |
 |
37
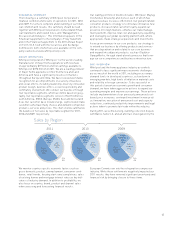
Significant regional trends were as follows:
• North America gross margin decreased compared to
2010 primarily due to significant increases in material
costs, partially offset by continued productivity improve-
ments and the favorable impact from product price/mix.
Gross margin also reflects the favorable impact from
$78 million in lower product recall charges and a $61
million supplier recovery payment received in 2011, par-
tially offset by $50 million in higher LIFO adjustments and
$27 million in lower postretirement curtailment gains.
North America gross margin for 2010 decreased com-
pared to 2009 primarily due to unfavorable product price/
mix, higher material costs, $43 million in higher product
recall charges, a $45 million variance in LIFO adjustments
compared to 2009 and $18 million in lower postretirement
curtailment gains. These items were partially offset by
continued cost reductions, improved productivity and
higher volumes.
• Latin America gross margin decreased compared to 2010
primarily due to higher material costs and the unfavorable
impact of foreign currency, partially offset by cost reduc-
tions and $41 million in higher BEFIEX credits recognized.
During 2010, Latin America gross margin increased
compared to 2009 primarily due to $156 million higher
BEFIEX credits recognized, cost reductions and improved
productivity, partially offset by unfavorable product
price/mix.
• EMEA gross margin decreased compared to 2010 pri-
marily due to higher material costs and the unfavorable
impact of product price/mix, partially offset by cost
reductions and improved productivity. During 2010, EMEA
gross margin increased compared to 2009 primarily due
to cost reductions and improved productivity, partially
offset by unfavorable product price/mix.
• Asia gross margin decreased compared to 2010 primarily
due to higher material costs, partially offset by productiv-
ity improvements and cost reductions, improved product
price/mix and the favorable impact of foreign currency.
Asia gross margin during 2010 decreased compared to
2009 primarily due to higher material and oil-related
costs and unfavorable product price/mix, partially offset
by the favorable impact of foreign currency.
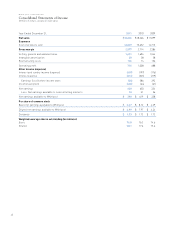
Selling, General and Administrative
Selling, general and administrative expenses remained flat
compared to 2010, with unfavorable foreign currency and
increased brand investments offset by lower employee
incentive compensation. Selling, general and administrative
expenses as a percent of consolidated net sales in 2010
decreased compared to 2009, primarily due to favorable
leverage on increased net sales. Selling, general and
administrative expenses in 2010 increased approximately
$54 million compared to 2009 in Latin America, primarily
due to the unfavorable impact of foreign currency and higher
infrastructure spending to support higher sales volumes.
Research and Development Costs
Research and development costs increased $46 million or
8.6% compared to 2010 to $578 million or 3.1% of consoli-
dated net sales. In 2010, research and development costs
increased $32 million or 6.4% compared to 2009 to $532
million or 2.9% of consolidated net sales. The increases
in 2011 and 2010 were primarily due to increased product
innovation spending.
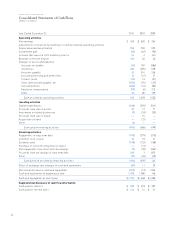
Restructuring
During the fourth quarter 2011, the Company committed to
restructuring plans (the “2011 Plan”) that will result in sub-
stantial cost and capacity reductions. Including previously
announced restructuring initiatives, we expect to incur
approximately $500 million of total costs beginning in the
fourth quarter 2011 with completion expected by the end
of 2013.
We expect to incur approximately $405 million of future
cash expenditures related to the 2011 Plan. We incurred
total restructuring charges of $136 million, $74 million and
$126 million during the years ended December 31, 2011,
2010 and 2009, respectively.
Interest and Sundry Income (Expense)
Interest and sundry expense increased $410 million com-
pared to 2010 to $607 million, primarily driven by charges
related to the settlement of the Brazilian collection dispute
and Embraco antitrust matters of $528 million in 2011 com-
pared to $146 million in 2010. In addition, 2011 reflects the
unfavorable impact of foreign currency. During 2010, inter-
est and sundry expense increased $22 million compared to
2009 to $197 million, primarily due to higher charges relat-
ing to the Embraco antitrust matters of approximately $40
million, partially offset by the favorable impacts of foreign
currency and higher interest income.
Interest Expense
Interest expense decreased $12 million compared to 2010 to
$213 million, primarily due to lower interest rates, partially
offset by higher average monthly debt levels. During 2010,
interest expense increased compared to 2009, as 2009 ben-
efited from an $8 million reduction in accrued interest as
a result of an operating tax settlement. In addition, 2010
included higher amortization of debt issuance costs, par-
tially offset by a reduction in interest expense due to lower
average debt levels and interest rates.
Income Taxes
The income tax benefit was $436 million, $64 million,
and $61 million in 2011, 2010 and 2009, respectively. The
increase in tax benefit in 2011 compared to 2010 and 2009
is primarily due to a reduction in pre-tax earnings, higher
energy tax credits generated in the United States from the
production of certain eligible energy efficient appliances
and higher non-taxable BEFIEX credits recognized in Brazil.