Whirlpool 2011 Annual Report Download - page 40
Download and view the complete annual report
Please find page 40 of the 2011 Whirlpool annual report below. You can navigate through the pages in the report by either clicking on the pages listed below, or by using the keyword search tool below to find specific information within the annual report.-
 1
1 -
2
-
3
-
4
-
5
-
6
-
7
-
8
-
9
-
10
-
11
-
12
-
13
-
14
-
15
-
16
-
17
-
18
-
19
-
20
-
21
-
22
-
23
-
24
-
25
-
26
-
27
-
28
-
29
-
 30
30 -
 31
31 -
 32
32 -
 33
33 -
 34
34 -
 35
35 -
 36
36 -
 37
37 -
 38
38 -
 39
39 -
 40
40 -
 41
41 -
 42
42 -
 43
43 -
 44
44 -
 45
45 -
 46
46 -
 47
47 -
 48
48 -
 49
49 -
 50
50 -
51
-
52
-
53
-
54
 |
 |

38
FORWARD-LOOKING PERSPECTIVE
We currently estimate earnings per diluted share, free
cash flow and industry demand for 2012 to be within the
following ranges:
(Millions of dollars, except per share data)
Current Outlook
Estimated earnings per diluted share, for the
year ending December 31, 2012 $5.00–$5.50
Including:
BEFIEX ($60 to $80 million) 0.80–1.00
Restructuring expense ($250–$270 million) (2.30)–(2.50)
Free cash flow $100–$150
Including:
Pension plan contributions (250)–(250)
Brazilian Collection Dispute & Embraco
Antitrust Matters (385)–(385)
Restructuring cash outlays (279)–(279)
BEFIEX 60–80
Industry demand
North America —%–3%
Latin America 2%–5%
EMEA (5)%–(2)%
Asia 2%–4%
The table below reconciles projected 2012 cash provided
by operations determined in accordance with generally
accepted accounting principles in the United States (GAAP)
to free cash flow, a non-GAAP measure. Management
believes that free cash flow provides stockholders with a
relevant measure of liquidity and a useful basis for assess-
ing Whirlpool’s ability to fund its activities and obligations.
There are limitations to using non-GAAP financial measures,
including the difficulty associated with comparing compa-
nies that use similarly named non-GAAP measures whose
calculations may differ from our calculations. We define
free cash flow as cash provided by continuing operations
after capital expenditures and proceeds from the sale of
assets/businesses.
These projections are based on many estimates and are
inherently subject to change based on future decisions
made by management and the Board of Directors of
Whirlpool, and significant economic, competitive and
other uncertainties and contingencies.
(Millions of dollars)
Current Outlook
Cash provided by operating activities $600–$700
Capital expenditures (500)–(550)
Proceeds from sale of assets/businesses —–—
Free cash flow $100–$150
FINANCIAL CONDITION AND LIQUIDITY
Our objective is to finance our business through operating
cash flow and the appropriate mix of long-term and short-
term debt. By diversifying the maturity structure, we avoid
concentrations of debt, reducing liquidity risk. We have
varying needs for short-term working capital financing as
a result of the nature of our business. We regularly review
our capital structure and liquidity priorities, which include
funding the business through capital and engineering
spending to support innovation and productivity initiatives,
funding our pension plan and term debt liabilities, payment
of legacy legal liabilities, return to shareholders and poten-
tial acquisitions in our core business and/or strategic
adjacent business opportunities. These priorities are
aligned with our goal to return our credit ratings to pre-
recession levels.
We have continued to operate under uncertain and volatile
global economic conditions for most of 2011, experiencing
higher material costs, recessionary demand levels in devel-
oped markets and slowing growth in emerging markets. To
succeed in this environment, we have announced aggressive
actions to improve our overall operating performance and
financial condition, including cost-based price increases
across all markets and plans to reduce our cost structure
and production capacity, primarily in North America and
EMEA. Based on the actions taken and announced in 2011,
we believe that operating cash flow, together with access to
sufficient sources of liquidity, will be adequate to meet our
ongoing requirements to fund our operations.
Our short-term potential uses of liquidity include funding
$350 million of term debt maturing in May 2012, $385 mil-
lion related to the Brazilian collection dispute and Embraco
antitrust matters, $279 million of restructuring activities
and approximately $250 million in our United States and
foreign pension plans. At December 31, 2011 and 2010, we
had no borrowings outstanding under credit facilities. We
were in compliance with financial covenant requirements
at December 31, 2011 and 2010.
We monitor the credit ratings and market indicators of
credit risk of our lending, depository, and derivative coun-
terparty banks regularly. We diversify our deposits and
investments in short-term cash equivalents to limit the
concentration of exposure by counterparty. The general
financial instability in the stressed European countries
could have a contagion effect on the region and contribute
to the general instability and uncertainty in the European
Union. At December 31, 2011, Belgium is the only European
country that has cash and cash equivalents and third-party
receivables exceeding 1% of our consolidated assets.
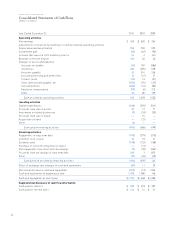
Sources and Uses of Cash
We met our cash needs for 2011 through cash flows from
operations, cash and cash equivalents and financing
arrangements. Our cash and equivalents were $1,109 million
at December 31, 2011 compared to $1,368 million at
December 31, 2010. The decrease in cash during 2011 is
primarily due to a third quarter payment related to the set-
tlement of the Brazilian collection dispute and contributions
to our U.S. funded pension plans, offset by cash generated
from operations.
Cash Flows from Operating Activities
The decrease in cash provided by operations during 2011
includes a $301 million payment related to the settlement
of the Brazilian collection dispute, funding of our United
States pension plans of $298 million and lower net earn-
ings, partially offset by significant reductions in inventory.
Cash provided by operating activities in 2010 decreased
$472 million compared to 2009, primarily from required
increases in inventory to support product availability and