Whirlpool 2011 Annual Report Download - page 44
Download and view the complete annual report
Please find page 44 of the 2011 Whirlpool annual report below. You can navigate through the pages in the report by either clicking on the pages listed below, or by using the keyword search tool below to find specific information within the annual report.-
 1
1 -
2
-
3
-
4
-
5
-
6
-
7
-
8
-
9
-
10
-
11
-
12
-
13
-
14
-
15
-
16
-
17
-
18
-
19
-
20
-
21
-
22
-
23
-
24
-
25
-
26
-
27
-
28
-
29
-
30
-
31
-
32
-
33
-
 34
34 -
 35
35 -
 36
36 -
 37
37 -
 38
38 -
 39
39 -
 40
40 -
 41
41 -
 42
42 -
 43
43 -
 44
44 -
 45
45 -
 46
46 -
 47
47 -
 48
48 -
 49
49 -
 50
50 -
 51
51 -
 52
52 -
 53
53 -
 54
54
 |
 |

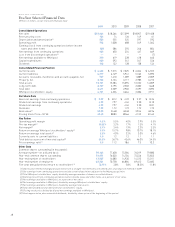
42
WHIRLPOOL CORPORATION
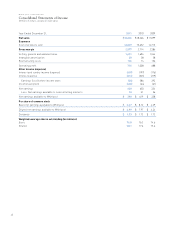
Consolidated Statements of Income
(Millions of dollars, except per share data)
Year Ended December 31, 2011 2010 2009
Net sales $ 18,666 $ 18,366 $ 17,099
Expenses
Cost of products sold 16,089 15,652 14,713
Gross margin 2,577 2,714 2,386
Selling, general and administrative 1,621 1,604 1,544
Intangible amortization 28 28 28
Restructuring costs 136 74 126
Operating profit 792 1,008 688
Other income (expense)
Interest and sundry income (expense) (607) (197) (176)
Interest expense (213) (225) (219)
Earnings (loss) before income taxes (28) 586 293
Income tax benefit (436) (64) (61)
Net earnings 408 650 354
Less: Net earnings available to noncontrolling interests 18 31 26
Net earnings available to Whirlpool $ 390 $ 619 $ 328
Per share of common stock
Basic net earnings available to Whirlpool $ 5.07 $ 8.12 $ 4.39
Diluted net earnings available to Whirlpool $ 4.99 $ 7.97 $ 4.34
Dividends $ 1.93 $ 1.72 $ 1.72
Weighted-average shares outstanding (in millions)
Basic 76.8 76.2 74.6
Diluted 78.1 77.6 75.6