Whirlpool 2011 Annual Report Download - page 50
Download and view the complete annual report
Please find page 50 of the 2011 Whirlpool annual report below. You can navigate through the pages in the report by either clicking on the pages listed below, or by using the keyword search tool below to find specific information within the annual report.-
 1
1 -
2
-
3
-
4
-
5
-
6
-
7
-
8
-
9
-
10
-
11
-
12
-
13
-
14
-
15
-
16
-
17
-
18
-
19
-
20
-
21
-
22
-
23
-
24
-
25
-
26
-
27
-
28
-
29
-
30
-
31
-
32
-
33
-
34
-
35
-
36
-
37
-
38
-
39
-
 40
40 -
 41
41 -
 42
42 -
 43
43 -
 44
44 -
 45
45 -
 46
46 -
 47
47 -
 48
48 -
 49
49 -
 50
50 -
 51
51 -
 52
52 -
 53
53 -
 54
54
 |
 |

48
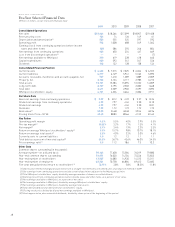
WHIRLPOOL CORPORATION
Five-Year Selected Financial Data
(Millions of dollars, except share and employee data)
2011 2010 2009 2008 2007
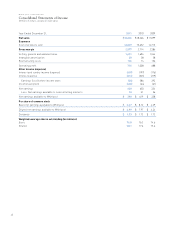
Consolidated Operations
Net sales $ 18,666 $ 18,366 $ 17,099 $ 18,907 $ 19,408
Restructuring costs 136 74 126 149 61
Depreciation and amortization(1) 558 555 525 597 593
Operating profit 792 1,008 688 549 1,063
Earnings (loss) from continuing operations before income
taxes and other items (28) 586 293 246 804
Net earnings from continuing operations 408 650 354 447 669
Loss from discontinued operations(2) —— — — (7)
Net earnings available to Whirlpool 390 619 328 418 640
Capital expenditures 608 593 541 547 536
Dividends 148 132 128 128 134
Consolidated Financial Position
Current assets $ 6,422 $ 7,315 $ 7,025 $ 6,044 $ 6,555
Current liabilities 6,297 6,149 5,941 5,563 5,893
Accounts receivable, inventories and accounts payable, net 947 1,410 1,389 1,889 2,009
Property, net 3,102 3,134 3,117 2,985 3,212
Total assets 15,181 15,584 15,094 13,532 14,009
Long-term debt 2,129 2,195 2,502 2,002 1,668
Total debt 2,491 2,509 2,903 2,597 2,093
Whirlpool stockholders’ equity 4,181 4,226 3,664 3,006 3,911
Per Share Data
Basic net earnings from continuing operations $ 5.07 $ 8.12 $ 4.39 $ 5.57 $ 8.24
Diluted net earnings from continuing operations 4.99 7.97 4.34 5.50 8.10
Diluted net earnings 4.99 7.97 4.34 5.50 8.01
Dividends 1.93 1.72 1.72 1.72 1.72
Book value(3) 53.50 54.48 48.48 39.54 48.96
Closing Stock Price—NYSE 47.45 88.83 80.66 41.35 81.63
Key Ratios
Operating profit margin 4.2% 5.5% 4.0% 2.9% 5.5%
Pre-tax margin(4) (0.2)% 3.2% 1.7% 1.3% 4.1%
Net margin(5) 2.1% 3.4% 1.9% 2.2% 3.3%
Return on average Whirlpool stockholders’ equity(6) 9.3% 15.7% 9.8% 10.7% 18.1%
Return on average total assets(7) 2.5% 4.0% 2.3% 3.0% 4.6%
Current assets to current liabilities 1.0 1.2 1.2 1.1 1.1
Total debt as a percent of invested capital(8) 36.8% 36.7% 43.6% 46.0% 34.5%
Price earnings ratio(9) 9.5 11.2 18.6 7.5 10.2
Other Data
Common shares outstanding (in thousands):
Average number—on a diluted basis 78,143 77,628 75,584 76,019 79,880
Year-end common shares outstanding 76,451 76,030 74,704 73,536 75,835
Year-end number of stockholders 13,527 14,080 14,930 14,515 15,011
Year-end number of employees 68,231 70,758 66,884 69,612 73,682
Five-year annualized total return to stockholders(10) (8.1)% 3.8% 5.8% (8.5)% 11.8%
(1) Depreciation method changed prospectively from a straight-line method to a modified units of production method in 2009.
(2) Our earnings from continuing operations exclude certain dispositions adjacent to the Maytag acquisition.
(3) Total Whirlpool stockholders’ equity divided by average number of shares on a diluted basis.
(4) Earnings (loss) from continuing operations before income taxes and other items, as a percent of net sales.
(5) Net earnings available to Whirlpool, as a percent of net sales.
(6) Net earnings available to Whirlpool, divided by average Whirlpool stockholders’ equity.
(7) Net earnings available to Whirlpool, divided by average total assets.
(8) Total debt divided by total debt and total stockholders’ equity.
(9) Closing stock price divided by diluted net earnings available to Whirlpool.
(10) Stock appreciation plus reinvested dividends, divided by share price at the beginning of the period.