Whirlpool 2011 Annual Report Download - page 46
Download and view the complete annual report
Please find page 46 of the 2011 Whirlpool annual report below. You can navigate through the pages in the report by either clicking on the pages listed below, or by using the keyword search tool below to find specific information within the annual report.-
 1
1 -
2
-
3
-
4
-
5
-
6
-
7
-
8
-
9
-
10
-
11
-
12
-
13
-
14
-
15
-
16
-
17
-
18
-
19
-
20
-
21
-
22
-
23
-
24
-
25
-
26
-
27
-
28
-
29
-
30
-
31
-
32
-
33
-
34
-
35
-
 36
36 -
 37
37 -
 38
38 -
 39
39 -
 40
40 -
 41
41 -
 42
42 -
 43
43 -
 44
44 -
 45
45 -
 46
46 -
 47
47 -
 48
48 -
 49
49 -
 50
50 -
 51
51 -
 52
52 -
 53
53 -
 54
54
 |
 |

44
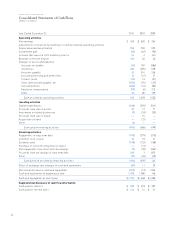
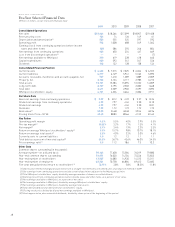
WHIRLPOOL CORPORATION
Consolidated Statements of Cash Flows
(Millions of dollars)
Year Ended December 31, 2011 2010 2009
Operating activities
Net earnings $ 408 $ 650 $ 354
Adjustments to reconcile net earnings to cash provided by operating activities:
Depreciation and amortization 558 555 525
Curtailment gain (35) (62) (92)
Increase (decrease) in LIFO inventory reserve 54 4 (41)
Brazilian collection dispute 144 63 46
Changes in assets and liabilities:
Accounts receivable (15) 187 (286)
Inventories 283 (595) 578
Accounts payable 25 341 326
Accrued advertising and promotions 14 (47) 21
Product recall (15) 13 (37)
Taxes deferred and payable, net (573) (94) (112)
Accrued pension (280) (16) (84)
Employee compensation (59) (6) 213
Other 21 85 139
Cash provided by operating activities 530 1,078 1,550
Investing activities
Capital expenditures (608) (593) (541)
Proceeds from sale of assets 23 17 77
Investment in related businesses (7) (18) (35)
Proceeds from sale of brand —15 —
Acquisition of brand —(27) —
Other (4) — —
Cash used in investing activities (596) (606) (499)
Financing activities
Repayments of long-term debt (313) (379) (210)
Common stock issued 14 72 21
Dividends paid (148) (132) (128)
Purchase of noncontrolling interest shares —(12) —
Net repayments from short-term borrowings (2) (20) (362)
Proceeds from borrowings of long-term debt 300 2 872
Other (17) (26) (49)
Cash (used in) provided by financing activities (166) (495) 144
Effect of exchange rate changes on cash and equivalents (27) 11 39
(Decrease) increase in cash and equivalents (259) (12) 1,234
Cash and equivalents at beginning of year 1,368 1,380 146
Cash and equivalents at end of year $ 1,109 $ 1,368 $ 1,380
Supplemental disclosure of cash flow information
Cash paid for interest $ 208 $ 218 $ 209
Cash paid for income taxes $ 136 $ 31 $ 51